16
16peptides
spectra
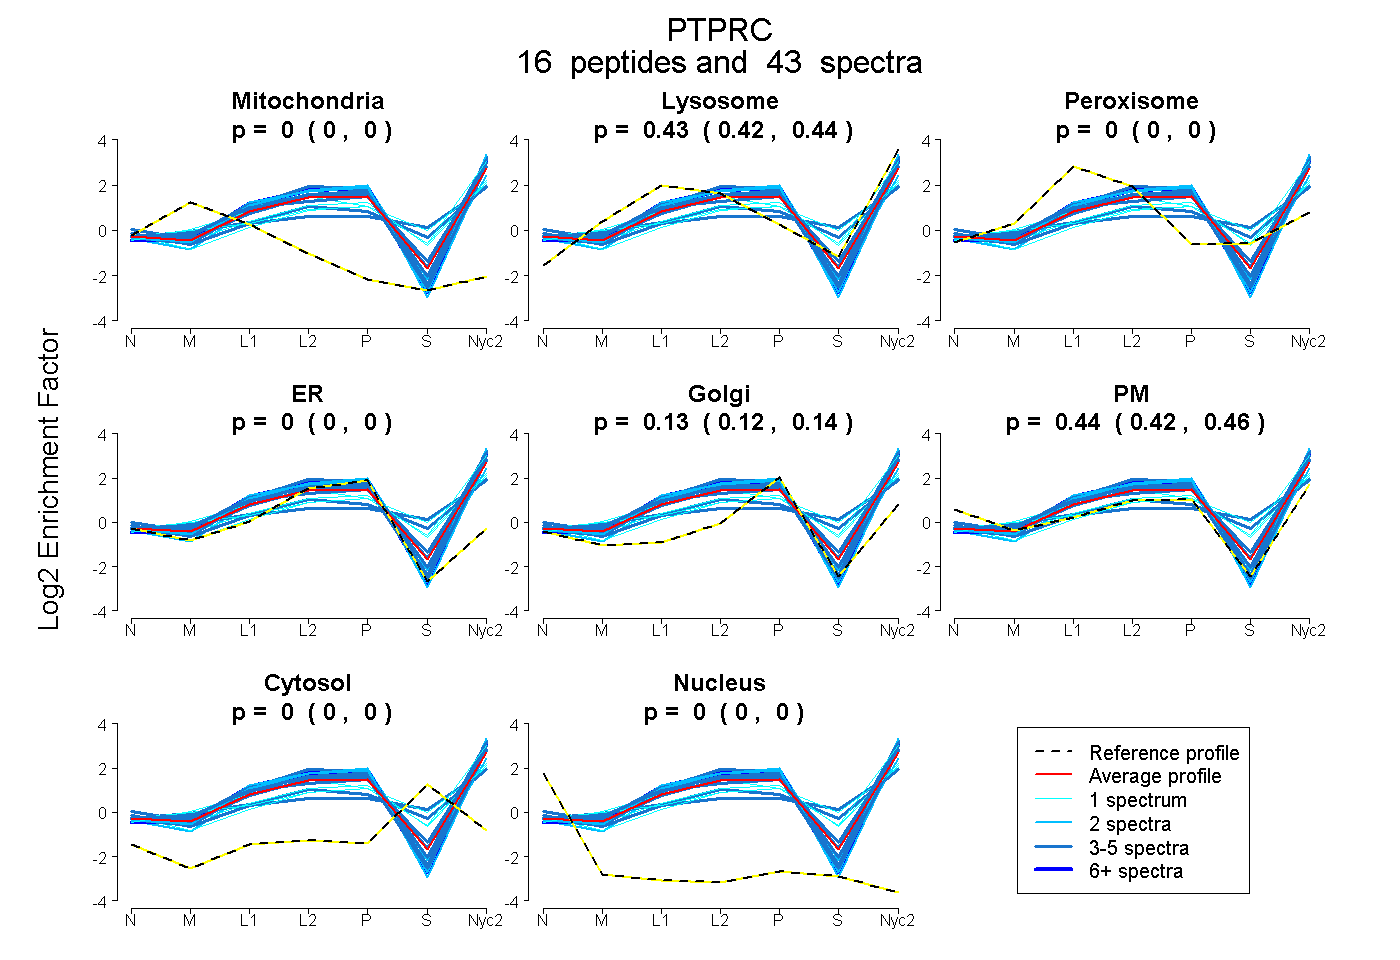
0.000 | 0.000
0.416 | 0.436
0.000 | 0.000
0.000 | 0.004
0.119 | 0.141
0.424 | 0.455
0.000 | 0.000
0.000 | 0.000
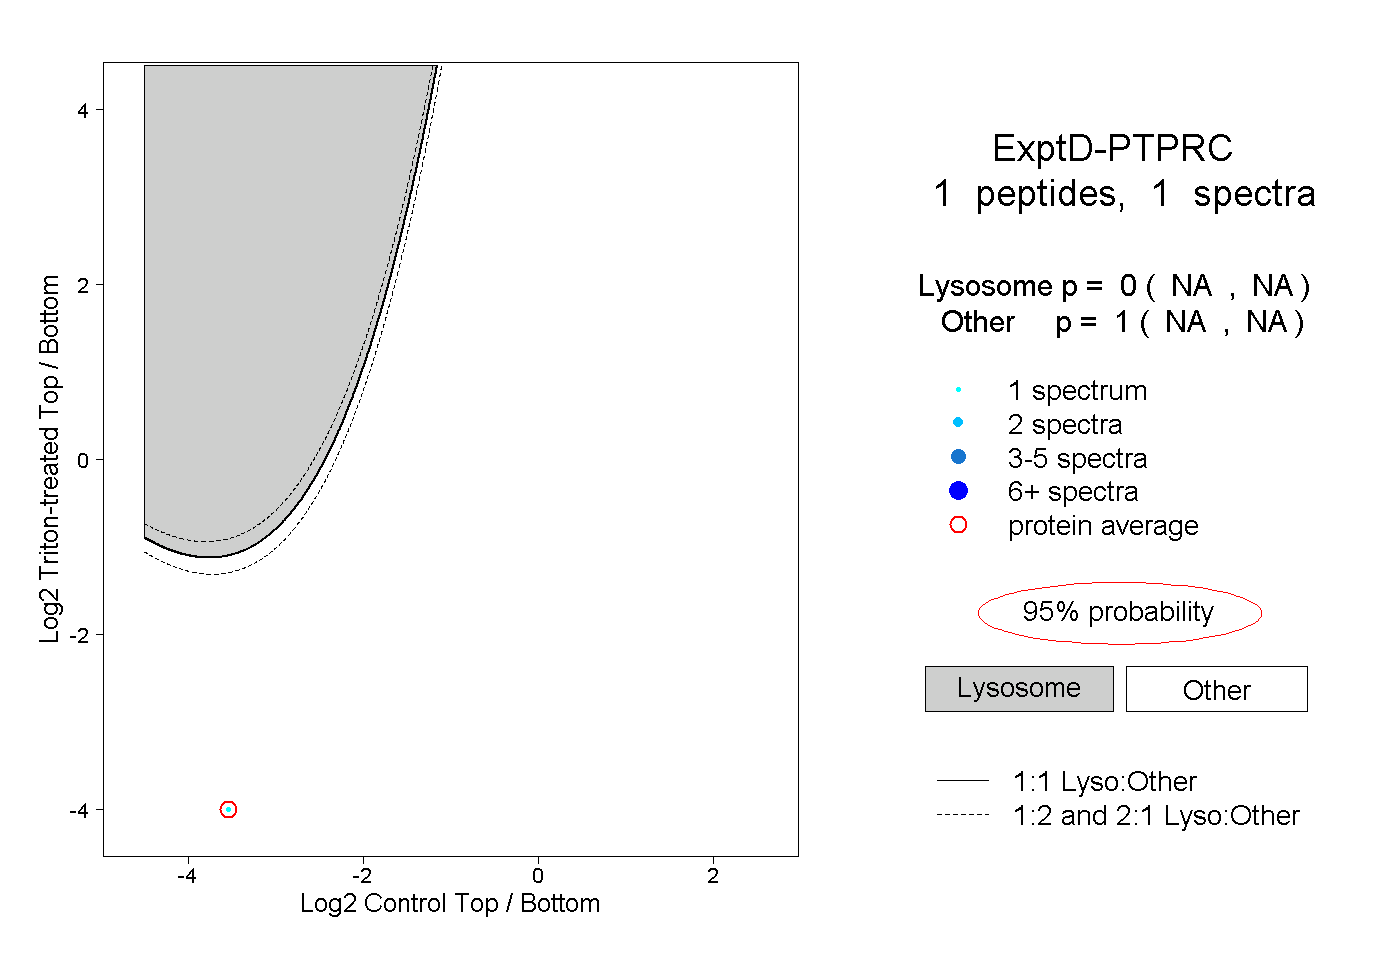
1peptide
spectrum
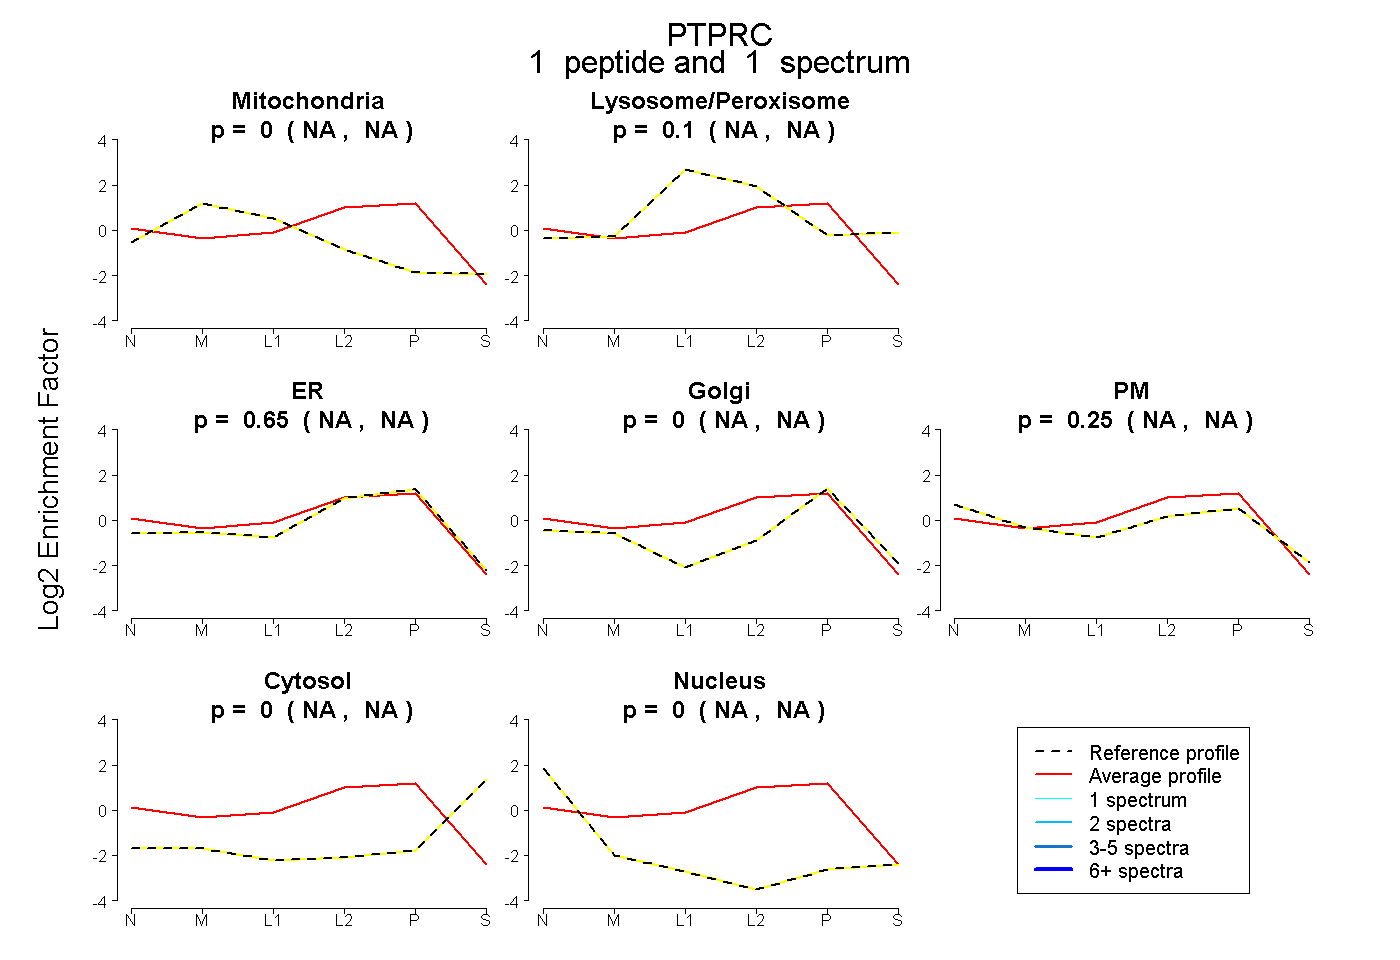
NA | NA
NA | NA
NA | NA
NA | NA
NA | NA
NA | NA
NA | NA
22peptides
spectra
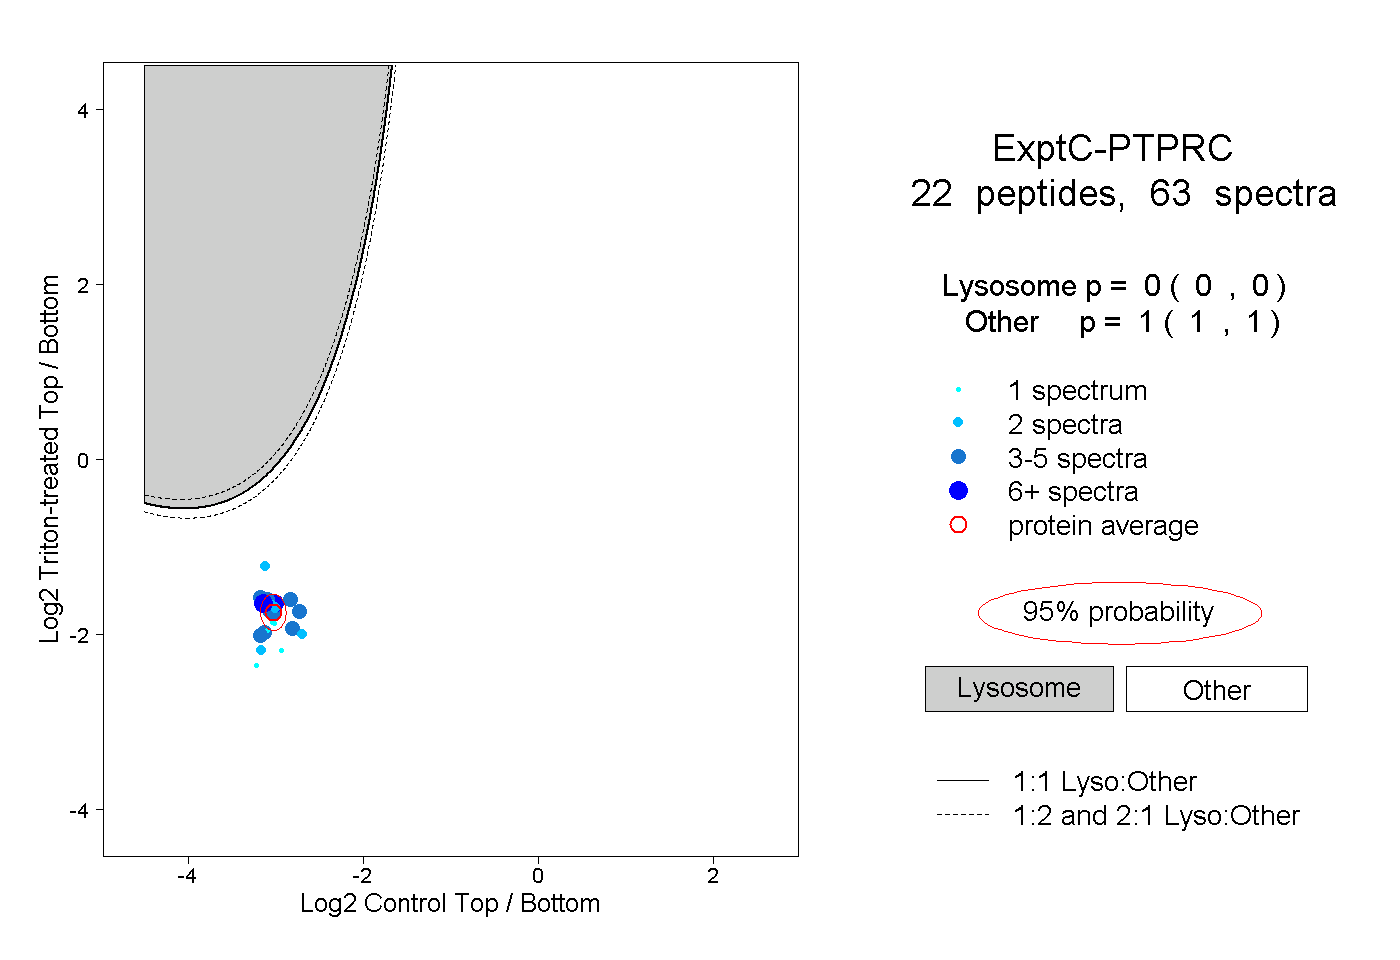
0.000 | 0.000
1.000 | 1.000