 18
18peptides
spectra
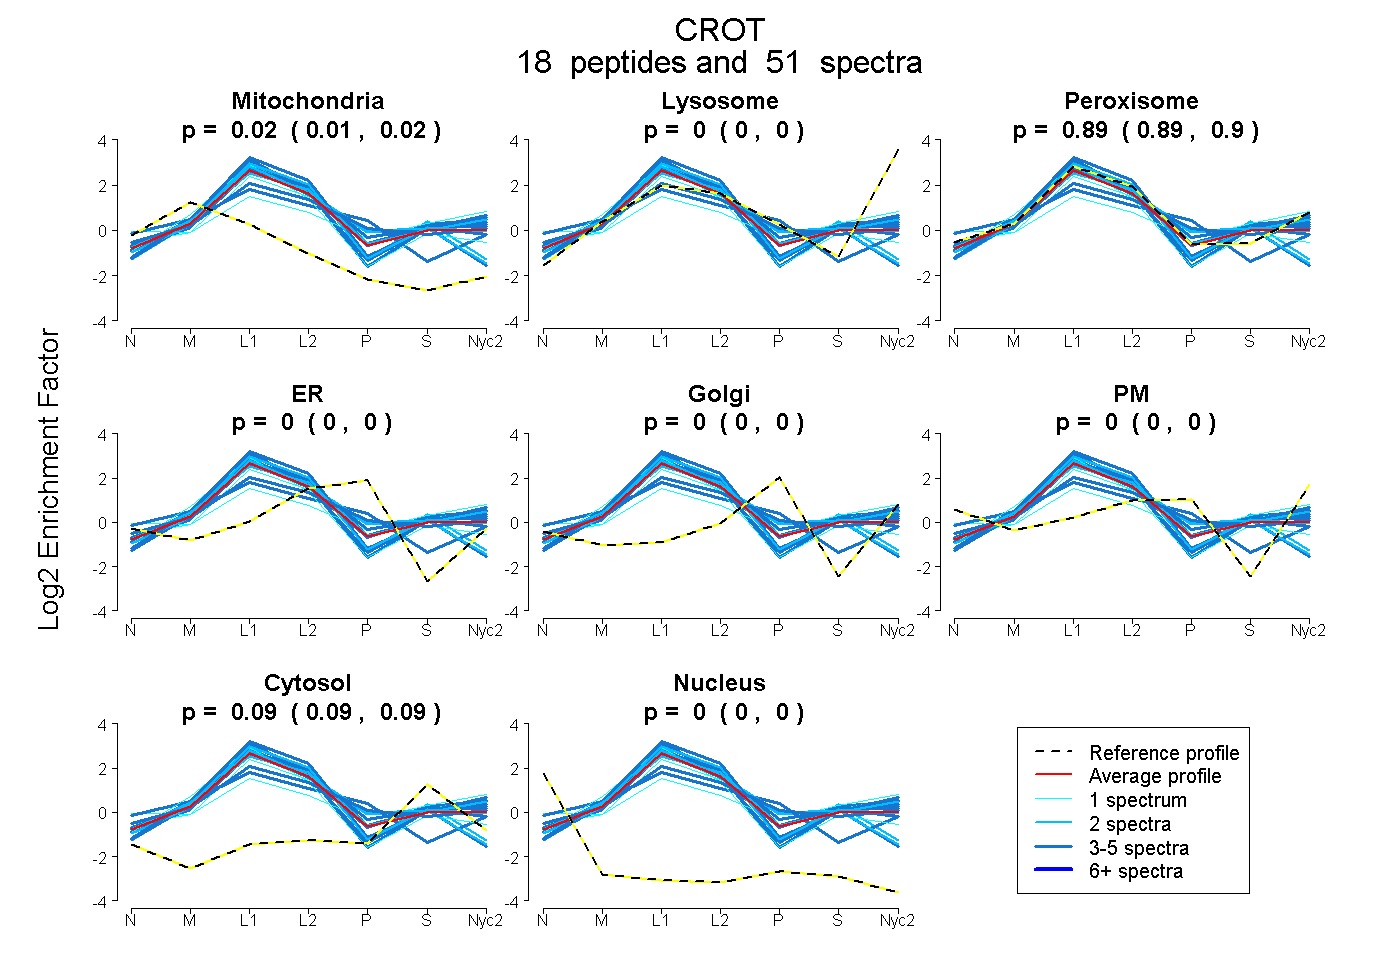
0.013 | 0.024
0.000 | 0.000
0.886 | 0.897
0.000 | 0.000
0.000 | 0.000
0.000 | 0.000
0.085 | 0.092
0.000 | 0.000
5peptides
spectra
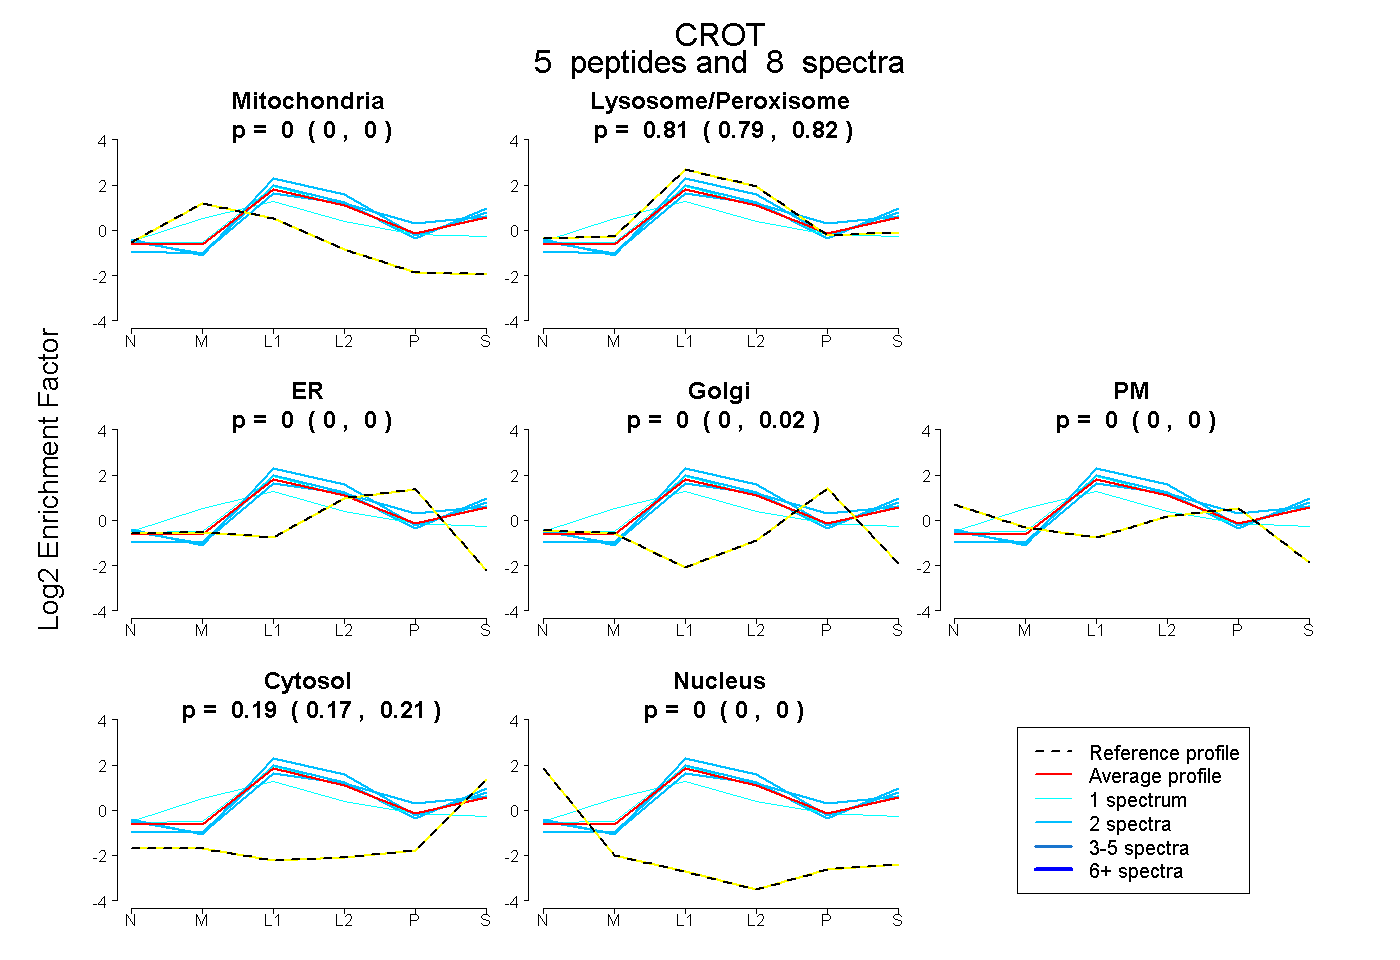
0.000 | 0.000
0.786 | 0.822
0.000 | 0.000
0.000 | 0.016
0.000 | 0.000
0.172 | 0.207
0.000 | 0.000
24peptides
spectra
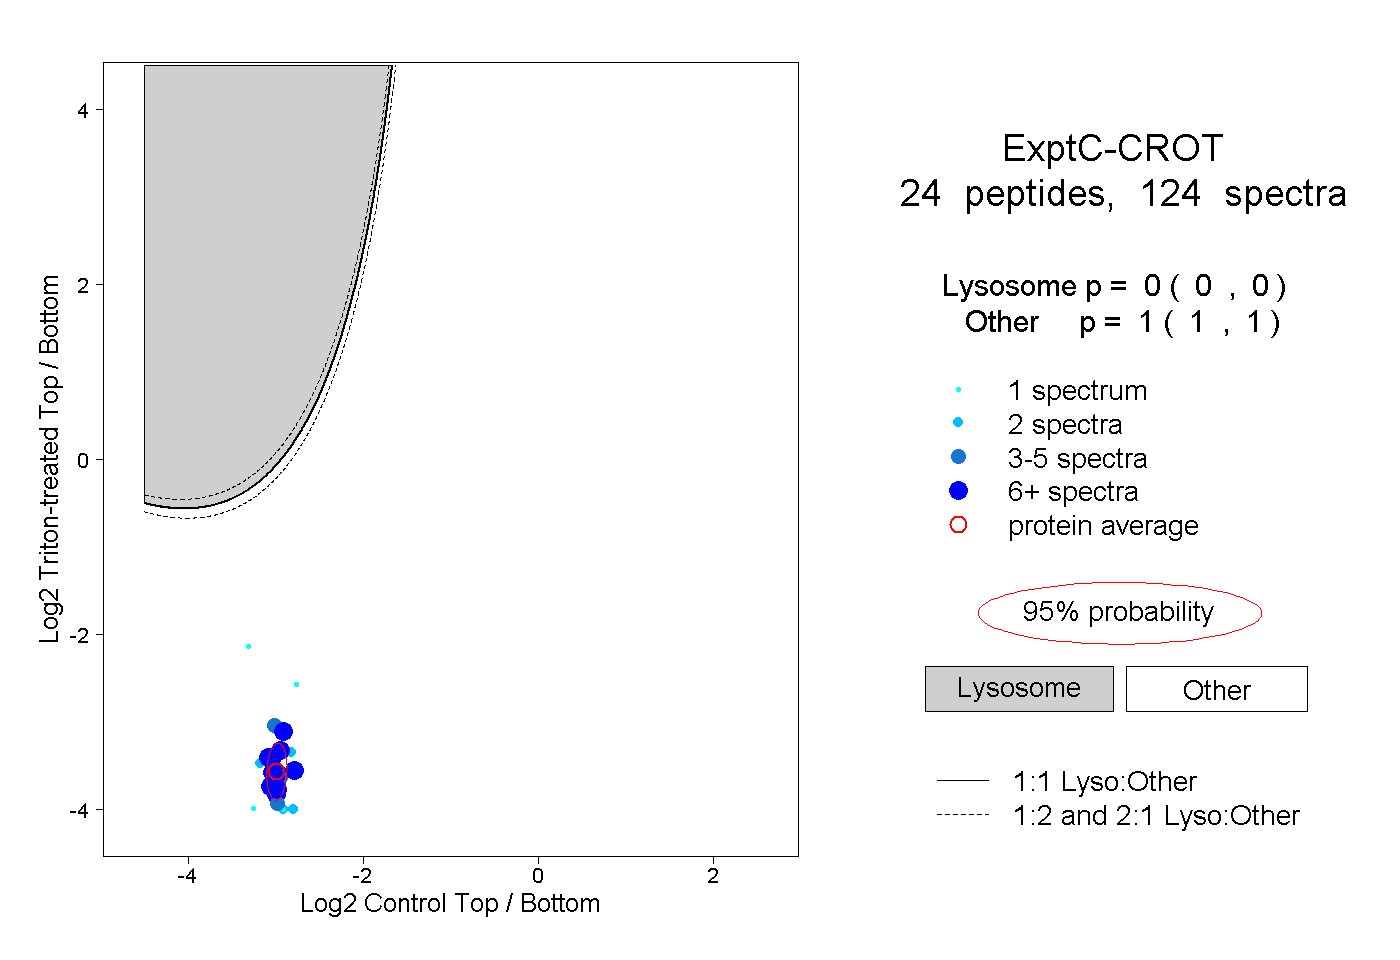
0.000 | 0.000
1.000 | 1.000
6peptides
spectra
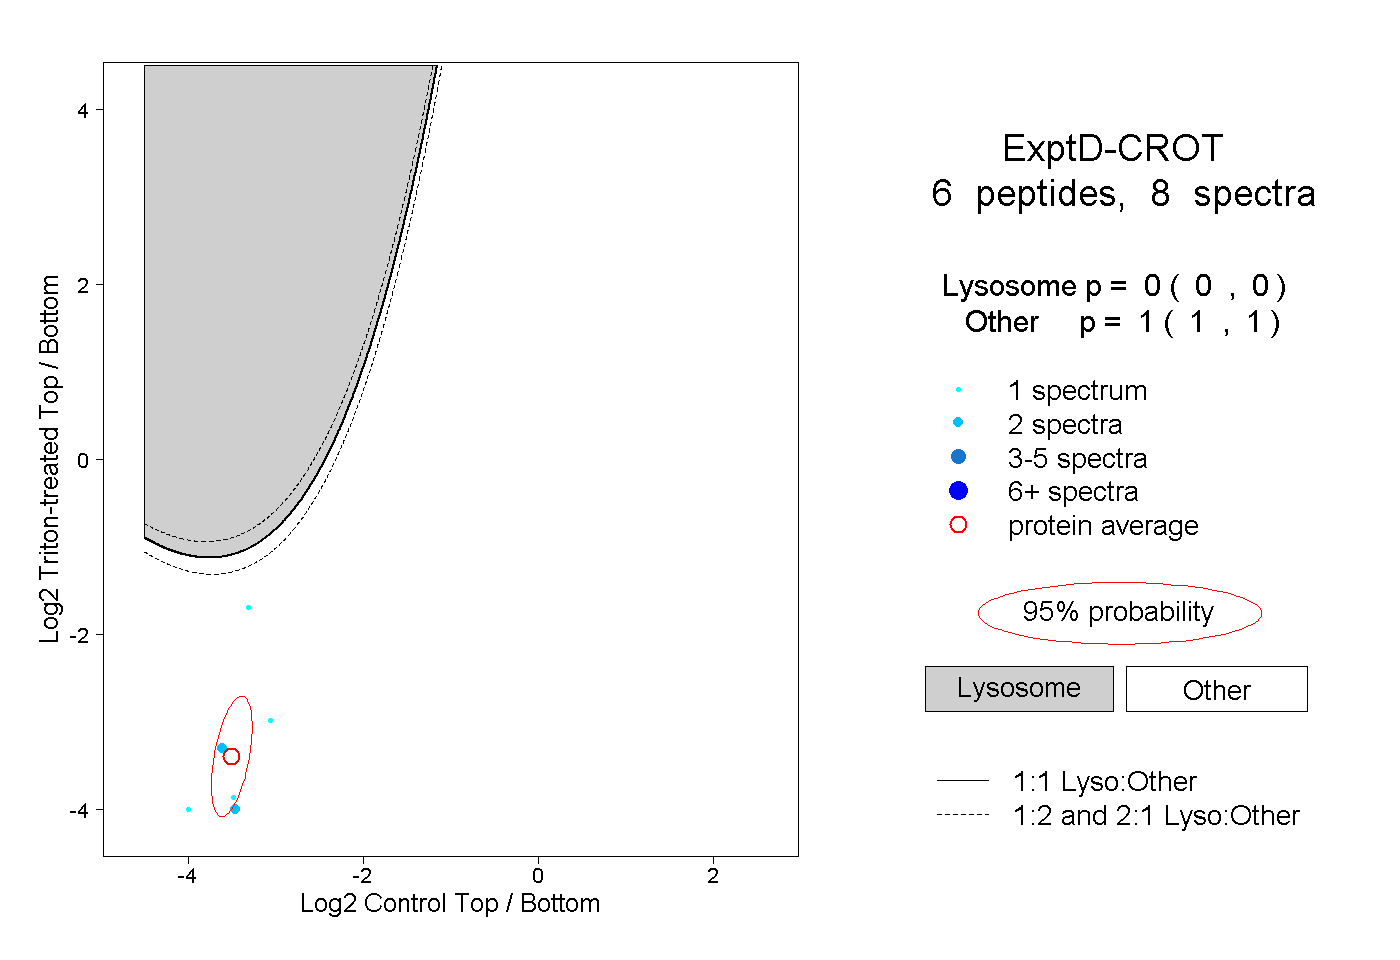
0.000 | 0.000
1.000 | 1.000