 14
14peptides
spectra
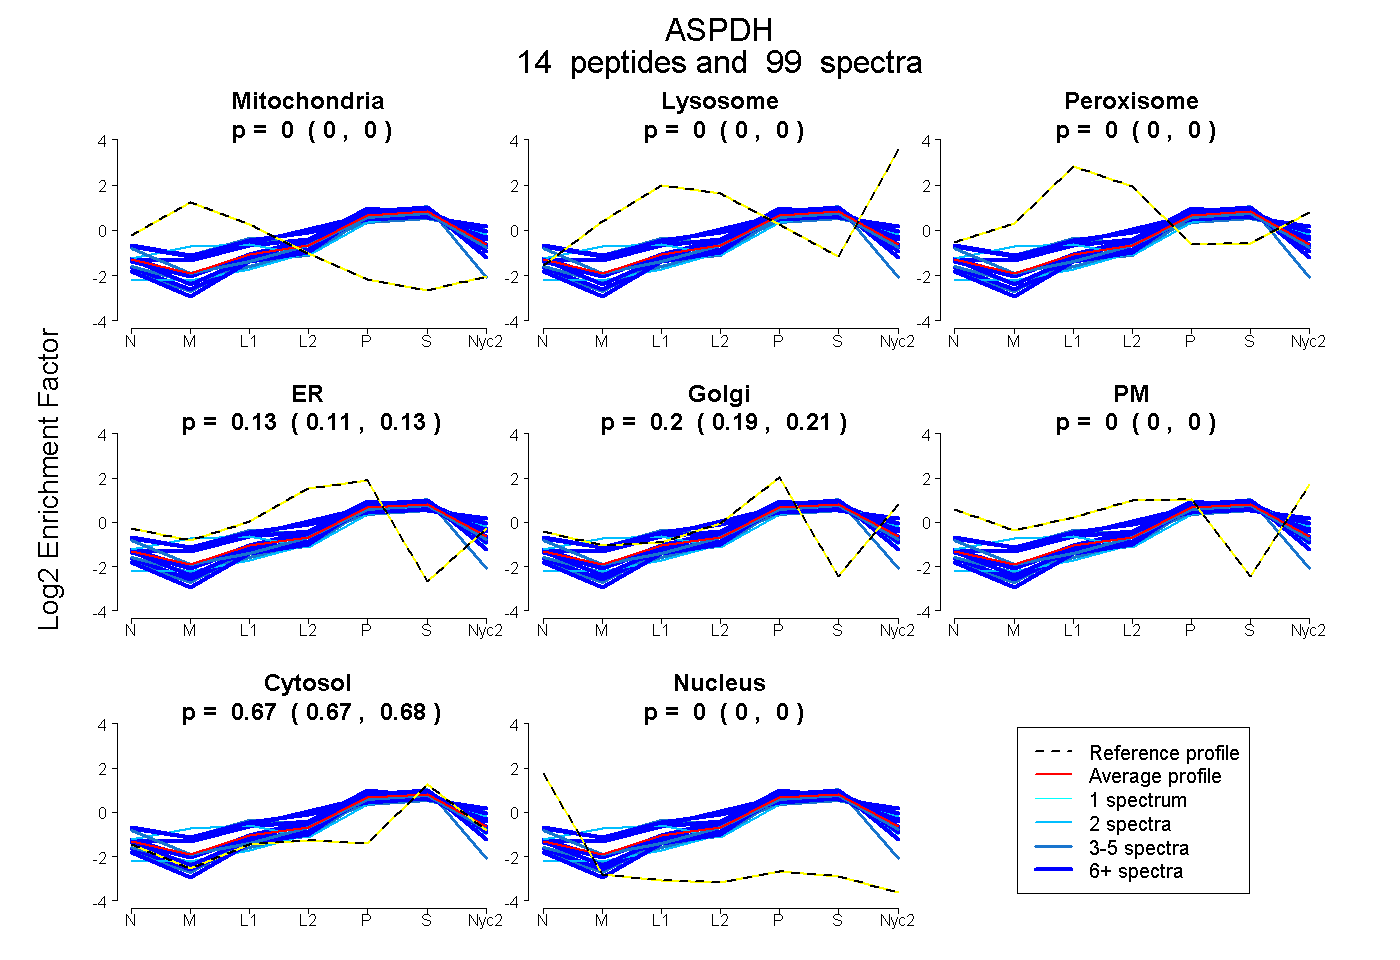
0.000 | 0.000
0.000 | 0.000
0.000 | 0.000
0.115 | 0.135
0.189 | 0.211
0.000 | 0.000
0.670 | 0.676
0.000 | 0.000
10peptides
spectra
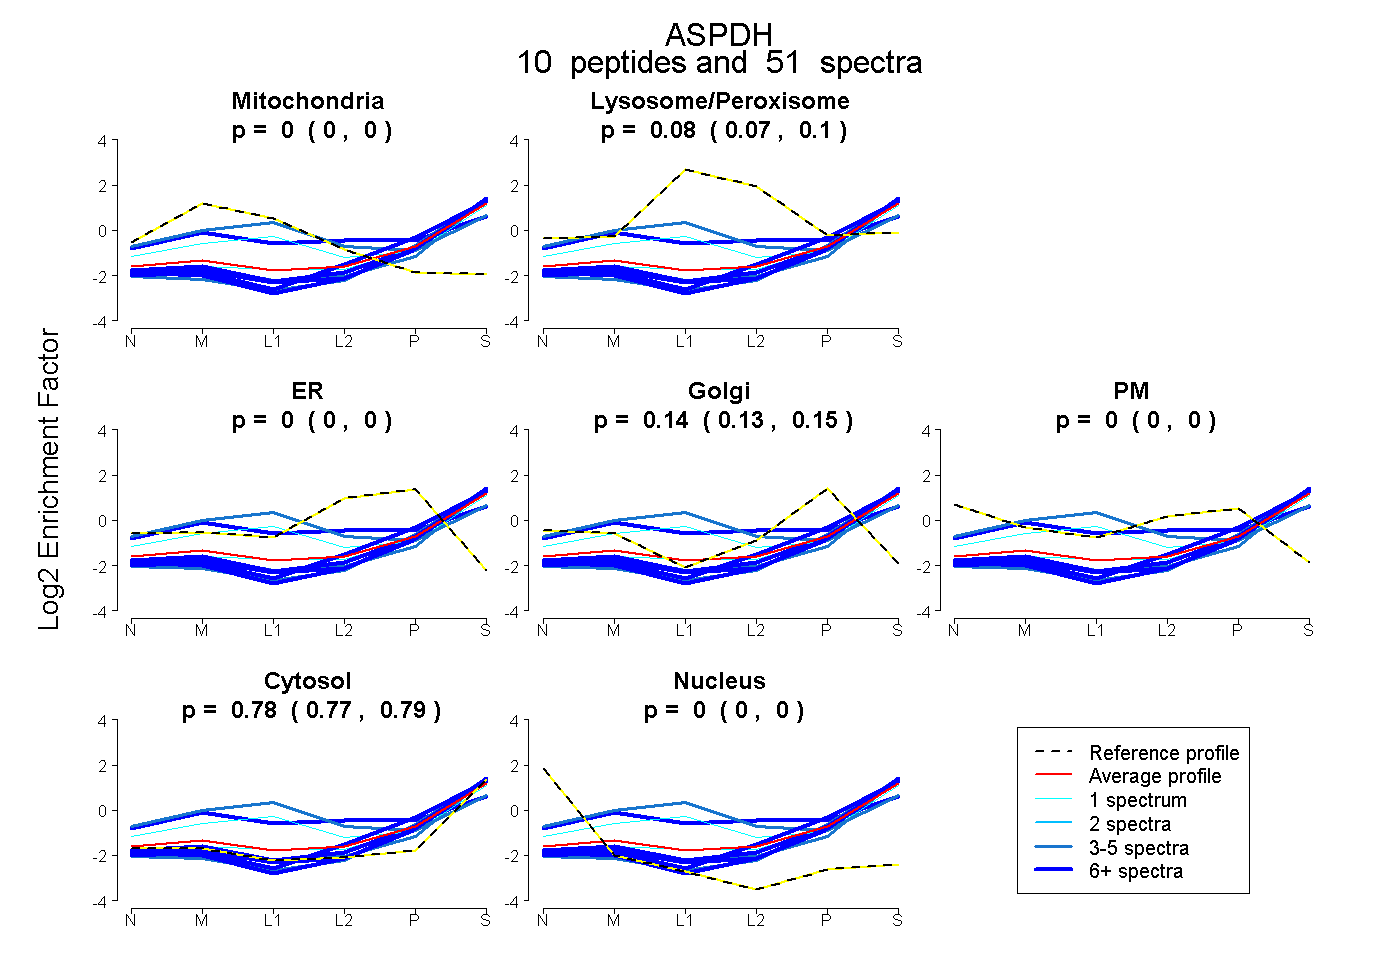
0.000 | 0.000
0.070 | 0.096
0.000 | 0.000
0.126 | 0.146
0.000 | 0.000
0.771 | 0.786
0.000 | 0.000
14peptides
spectra
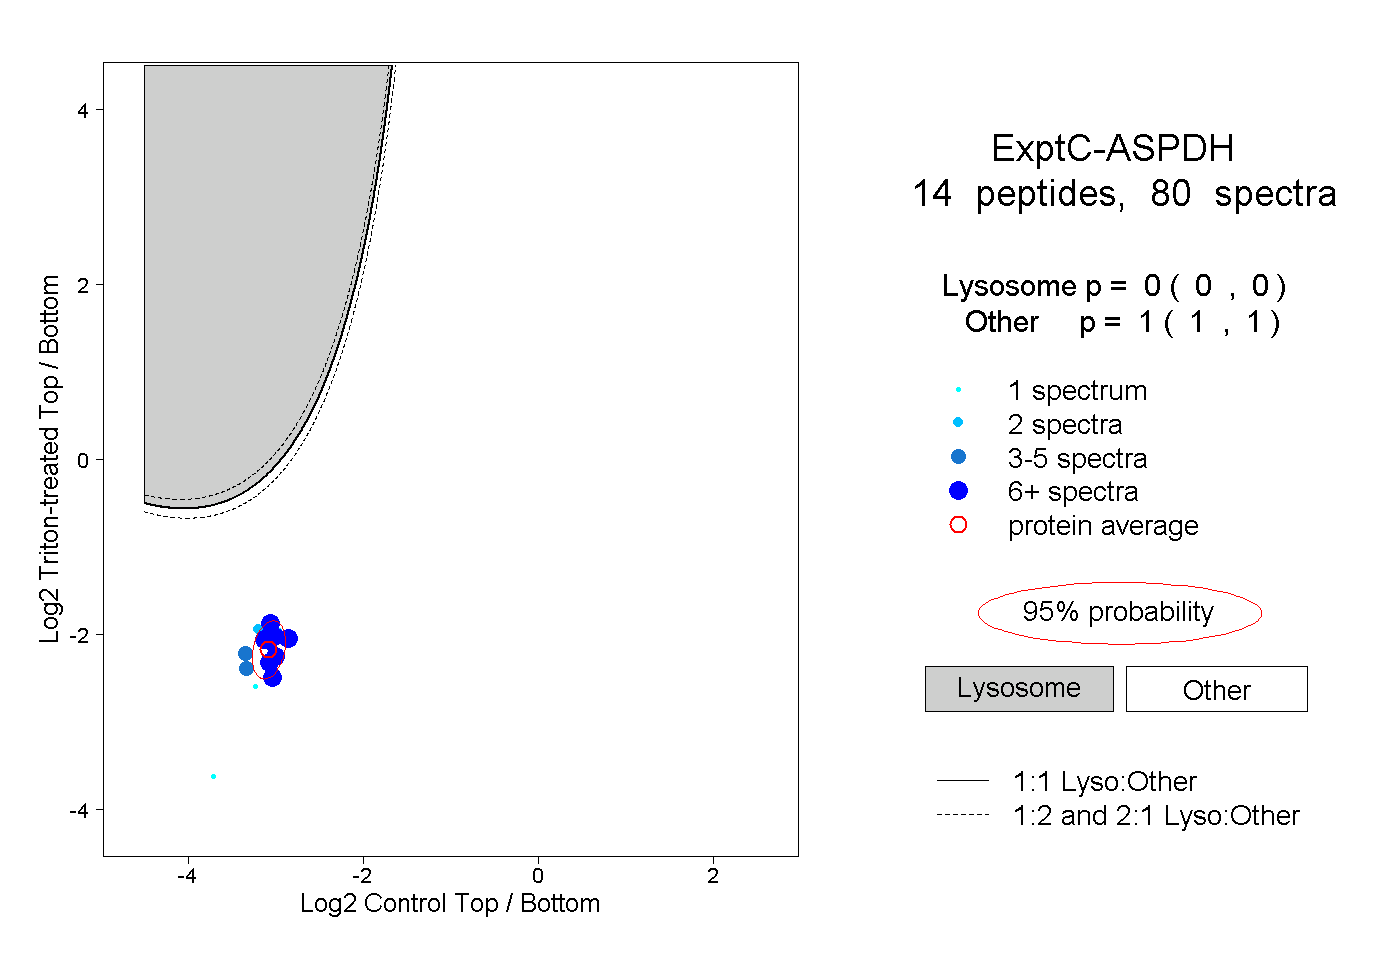
0.000 | 0.000
1.000 | 1.000
5peptides
spectra
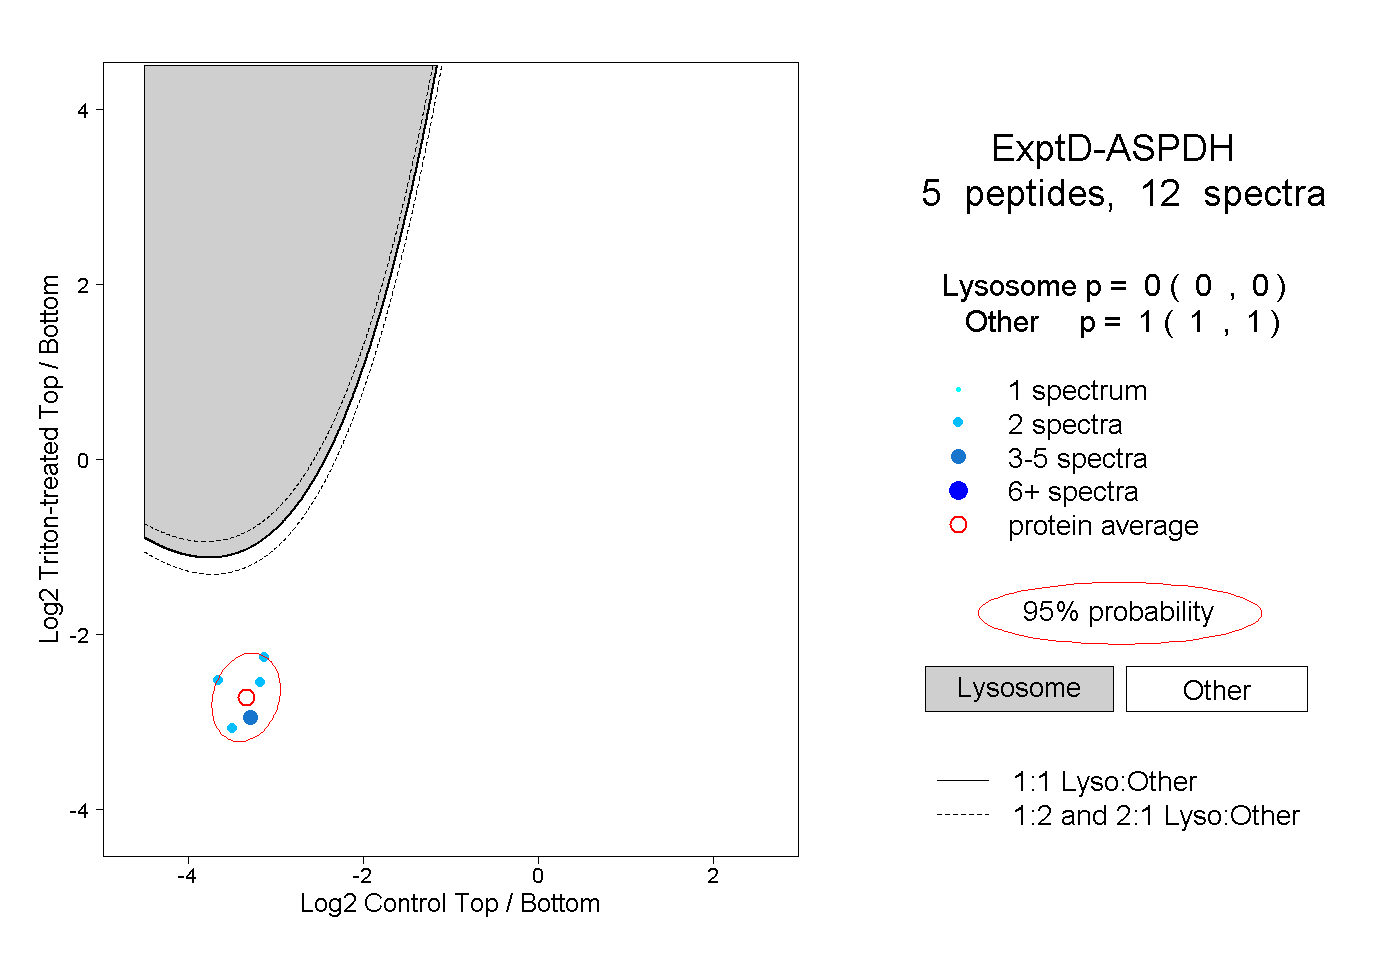
0.000 | 0.000
1.000 | 1.000