 4
4peptides
spectra
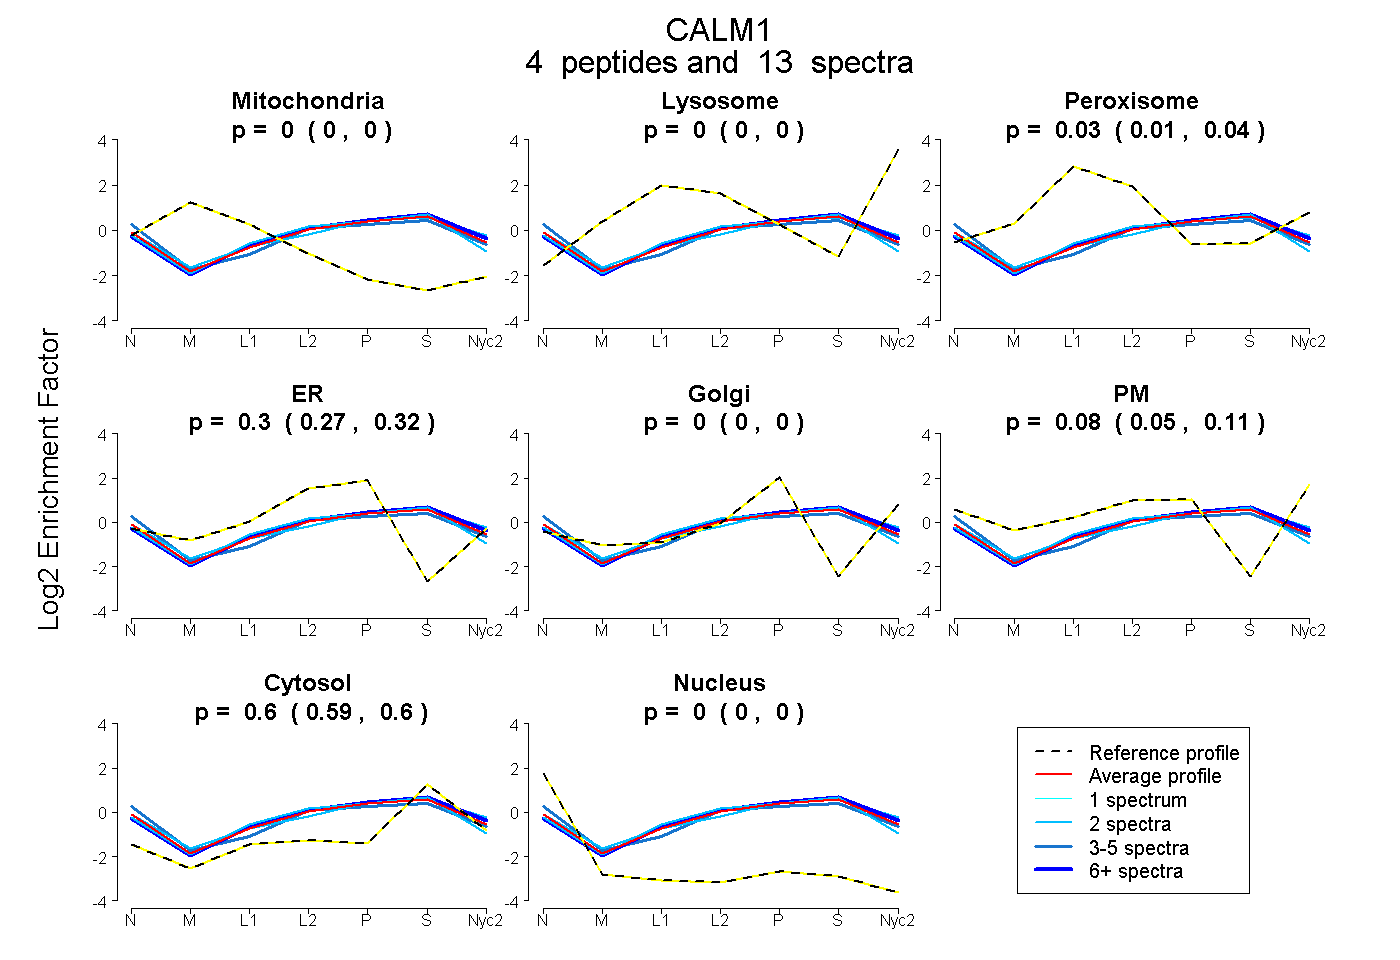
0.000 | 0.000
0.000 | 0.000
0.013 | 0.038
0.268 | 0.318
0.000 | 0.000
0.048 | 0.111
0.590 | 0.604
0.000 | 0.000
| Plot | Mito | Lyso | Perox | ER | Golgi | PM | Cytosol | Nucleus | |||||
| Expt A |
4 peptides |
13 spectra |
|
0.000 0.000 | 0.000 |
0.000 0.000 | 0.000 |
0.027 0.013 | 0.038 |
0.295 0.268 | 0.318 |
0.000 0.000 | 0.000 |
0.081 0.048 | 0.111 |
0.598 0.590 | 0.604 |
0.000 0.000 | 0.000 |
| 6 spectra, ELGTVMR | 0.000 | 0.000 | 0.051 | 0.272 | 0.000 | 0.080 | 0.597 | 0.000 | ||
| 2 spectra, EAFSLFDK | 0.000 | 0.000 | 0.014 | 0.177 | 0.000 | 0.218 | 0.591 | 0.000 | ||
| 2 spectra, LTDEEVDEMIR | 0.000 | 0.000 | 0.058 | 0.343 | 0.000 | 0.000 | 0.599 | 0.000 | ||
| 3 spectra, DGNGYISAAELR | 0.000 | 0.000 | 0.000 | 0.273 | 0.000 | 0.137 | 0.575 | 0.015 |
| Plot | Mito | Lyso or Perox | ER | Golgi | PM | Cytosol | Nucleus | ||||||
| Expt B |
1 peptide |
2 spectra |
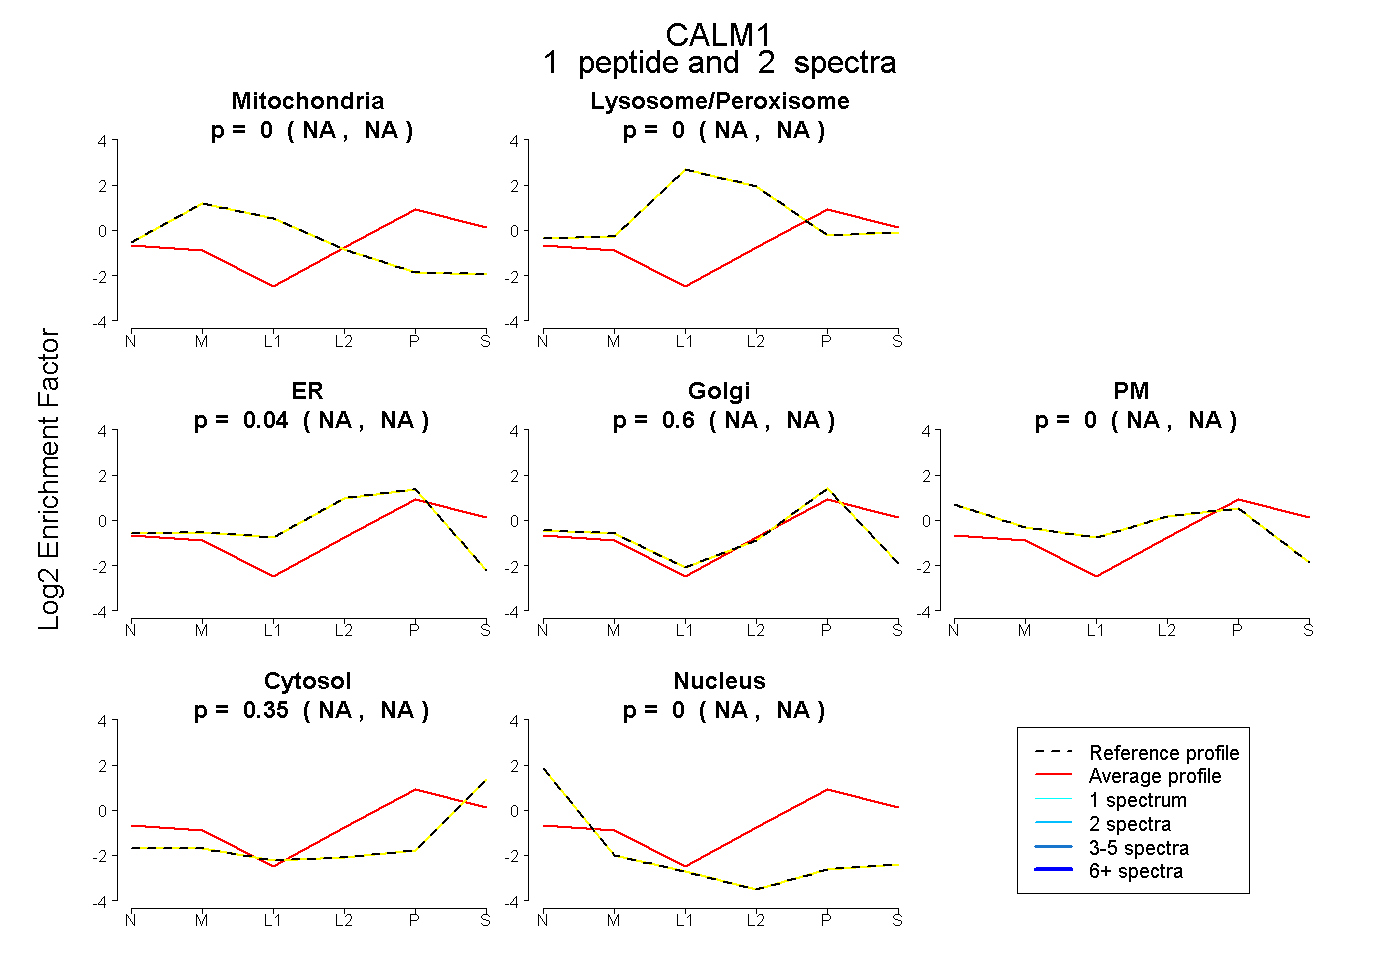 |
0.000 NA | NA |
0.000 NA | NA |
0.044 NA | NA |
0.602 NA | NA |
0.000 NA | NA |
0.353 NA | NA |
0.000 NA | NA |
|||
| Plot | Lyso | Other | |||||||||||
| Expt C |
6 peptides |
42 spectra |
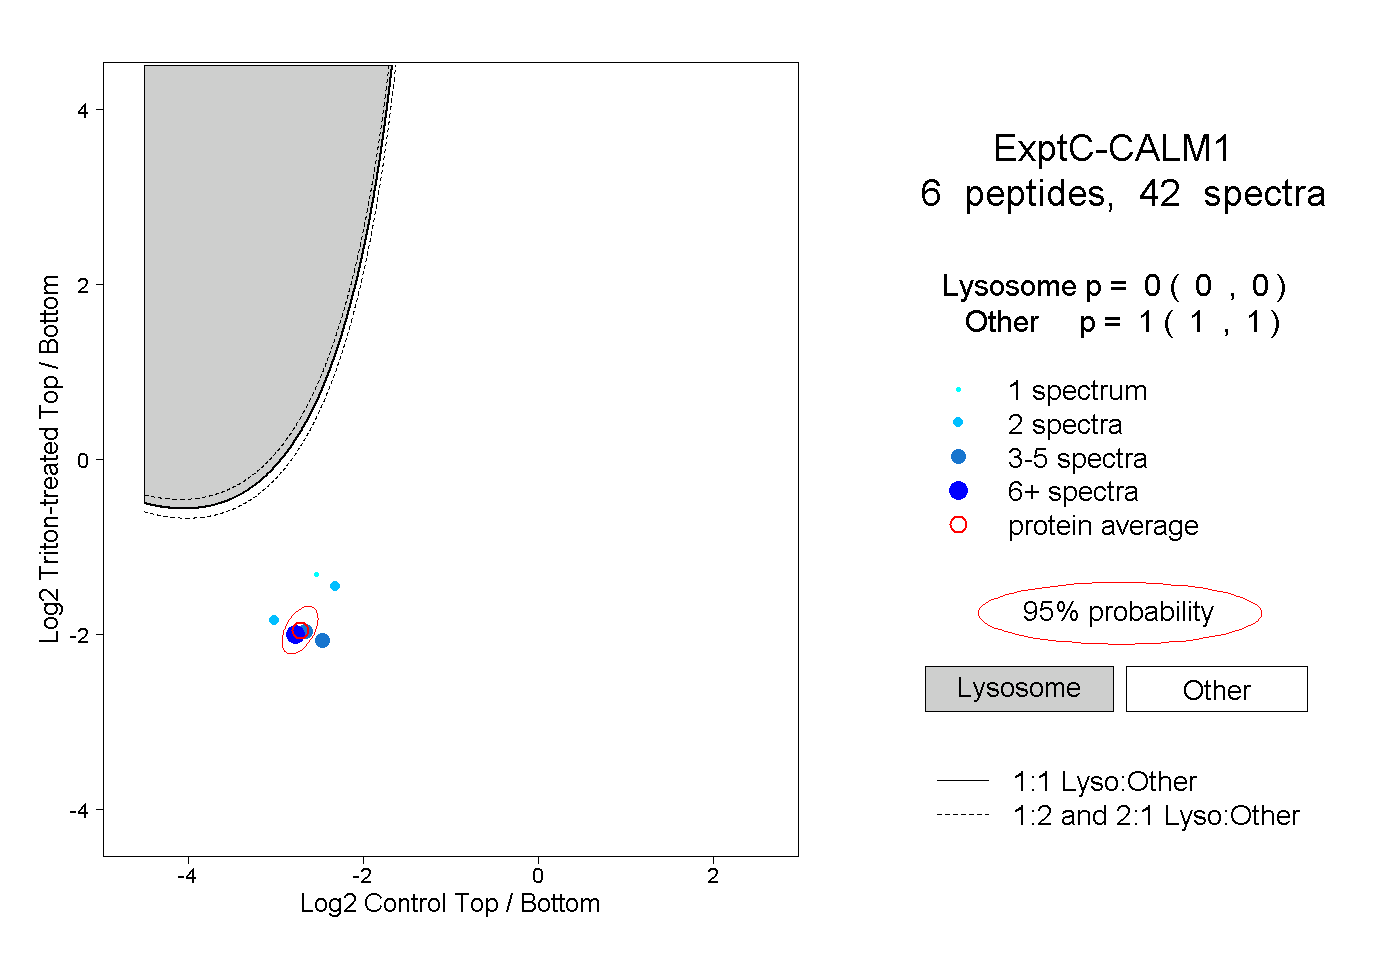 |
0.000 0.000 | 0.000 |
1.000 1.000 | 1.000 |