18
18peptides
spectra
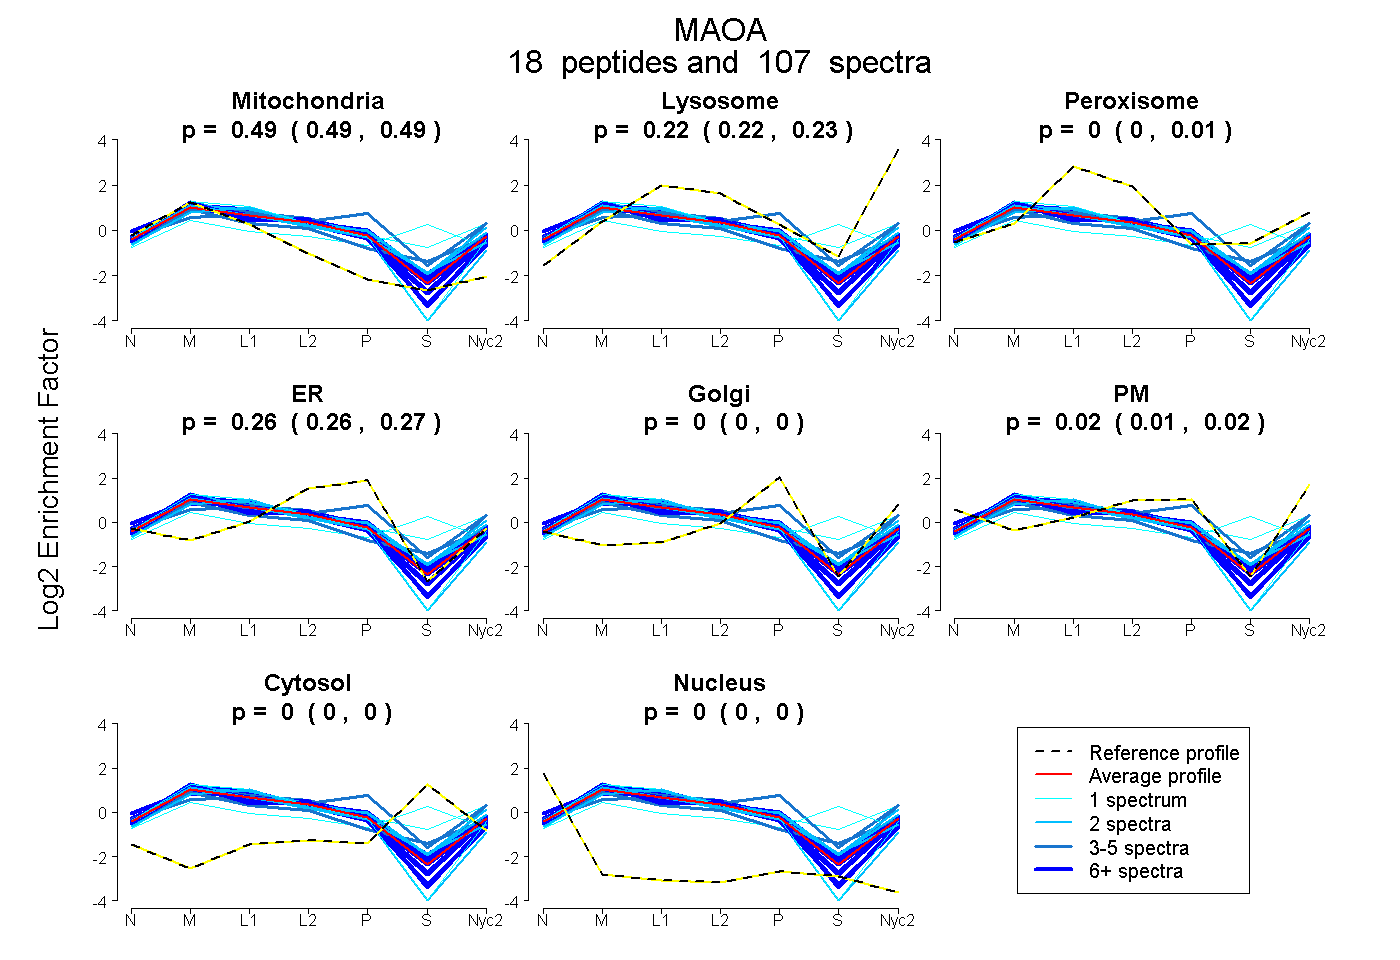
0.488 | 0.493
0.219 | 0.227
0.000 | 0.009
0.259 | 0.269
0.000 | 0.000
0.011 | 0.021
0.000 | 0.000
0.000 | 0.000
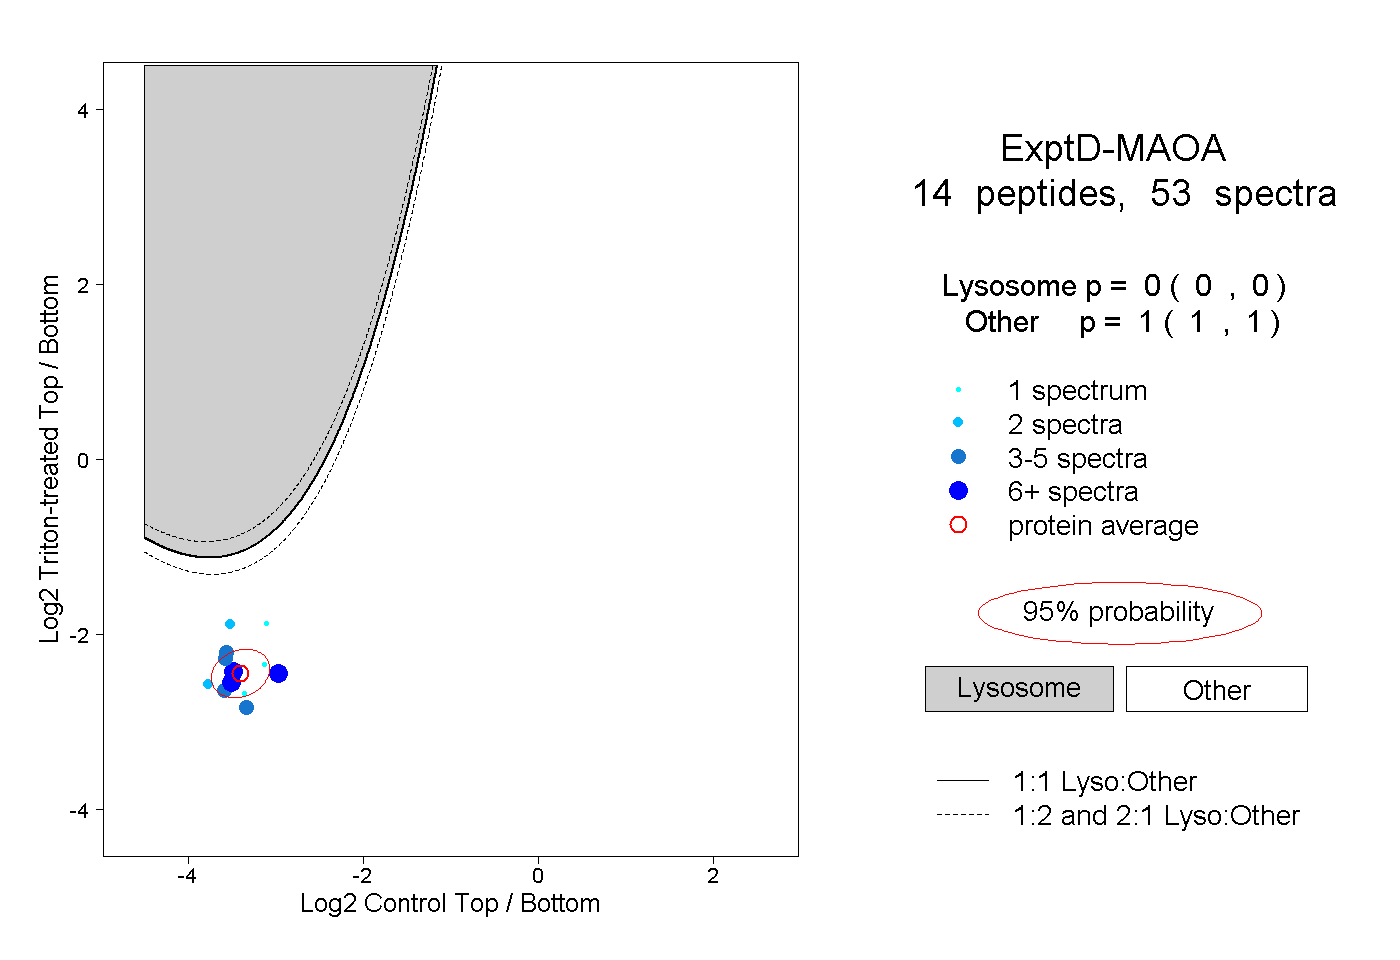
14peptides
spectra
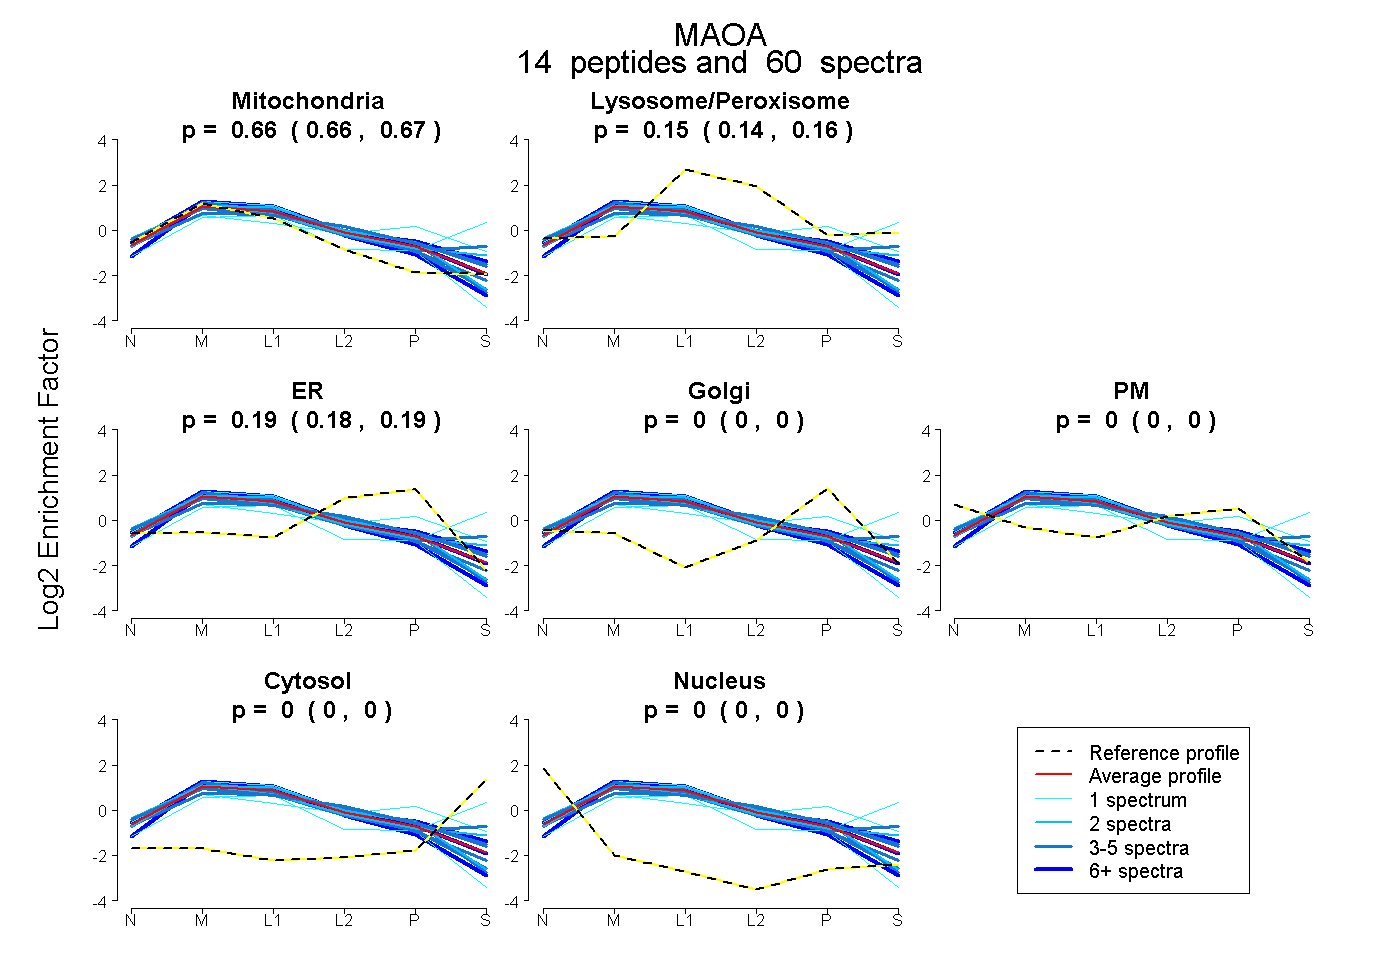
0.658 | 0.666
0.143 | 0.157
0.180 | 0.191
0.000 | 0.000
0.000 | 0.000
0.000 | 0.000
0.000 | 0.000
18peptides
spectra
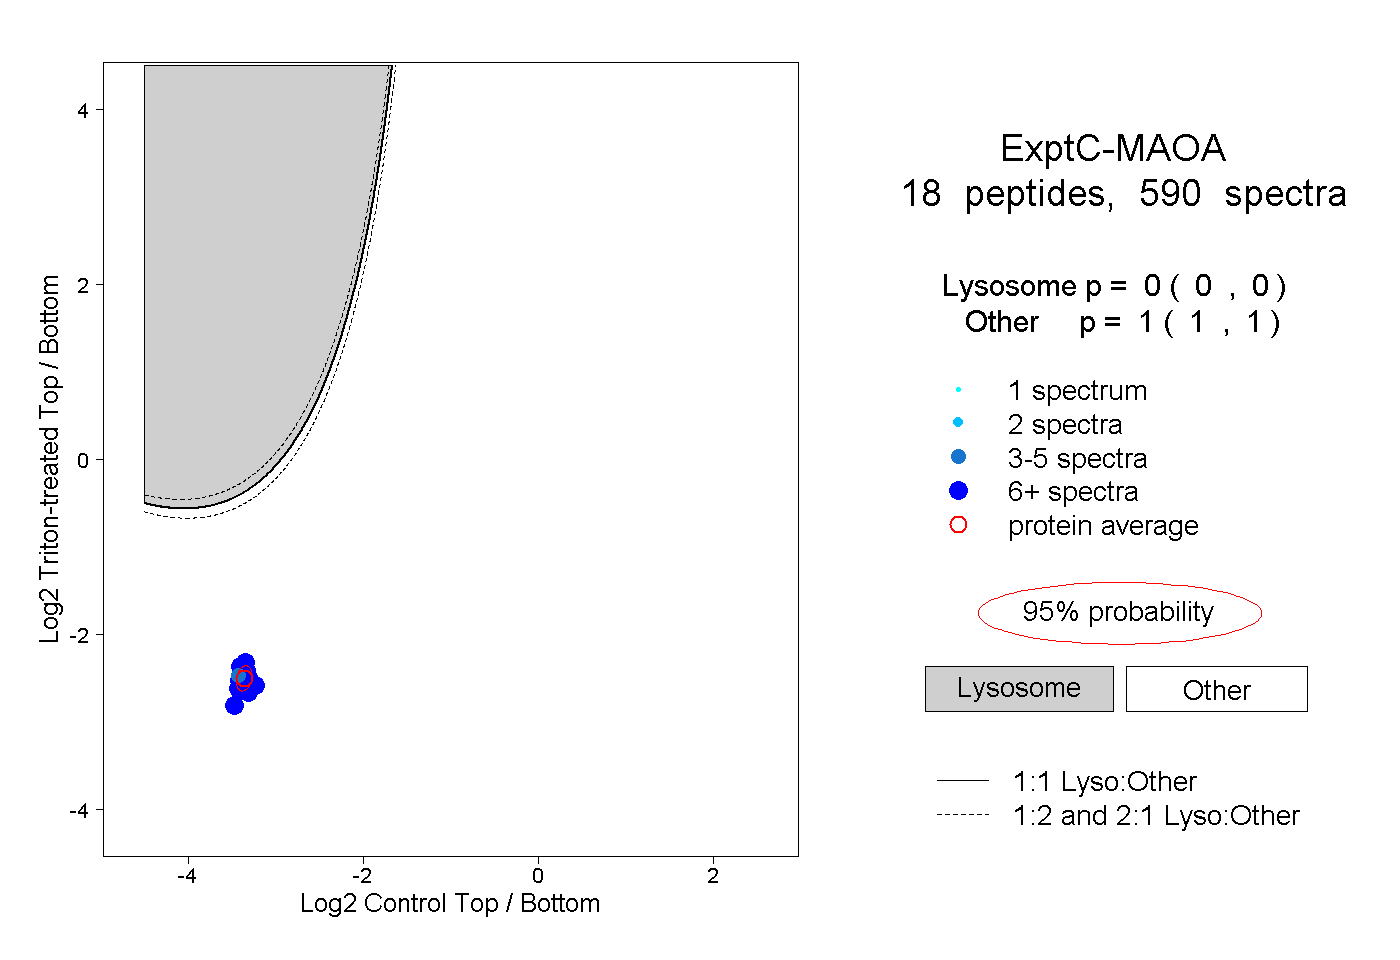
0.000 | 0.000
1.000 | 1.000