 1
1peptide
spectra
0.000 | 0.000
0.232 | 0.370
0.000 | 0.000
0.062 | 0.190
0.308 | 0.490
0.005 | 0.273
0.000 | 0.000
0.000 | 0.000
3peptides
spectra
0.000 | 0.000
1.000 | 1.000
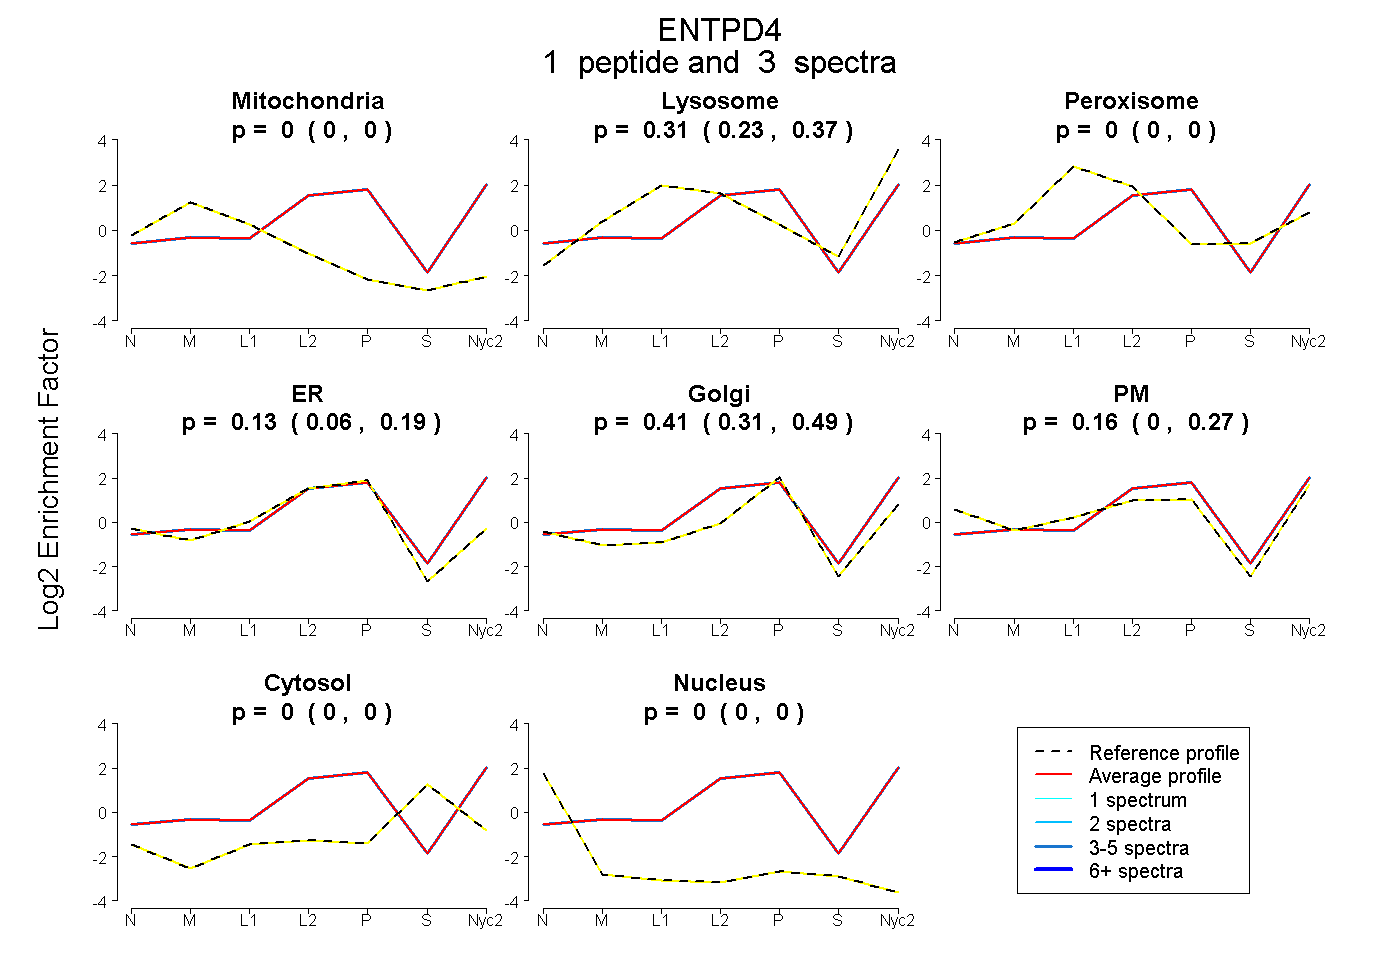
| Plot | Mito | Lyso | Perox | ER | Golgi | PM | Cytosol | Nucleus | |||||
| Expt A |
1 peptide |
3 spectra |
|
0.000 0.000 | 0.000 |
0.307 0.232 | 0.370 |
0.000 0.000 | 0.000 |
0.131 0.062 | 0.190 |
0.407 0.308 | 0.490 |
0.155 0.005 | 0.273 |
0.000 0.000 | 0.000 |
0.000 0.000 | 0.000 |
||
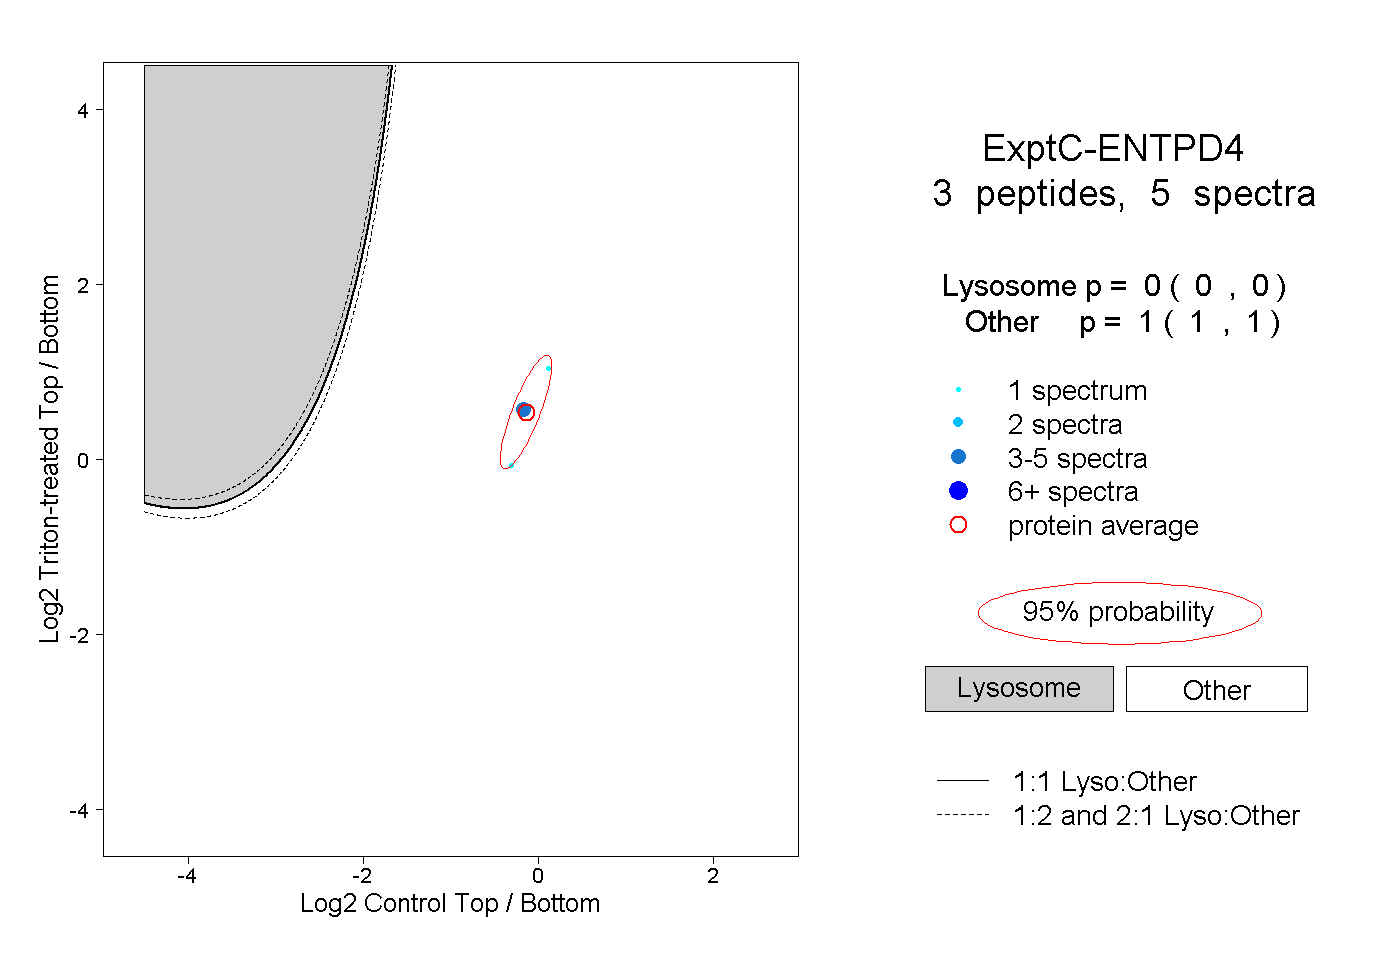
| Plot | Lyso | Other | |||||||||||
| Expt C |
3 peptides |
5 spectra |
|
0.000 0.000 | 0.000 |
1.000 1.000 | 1.000 |