 14
14peptides
spectra
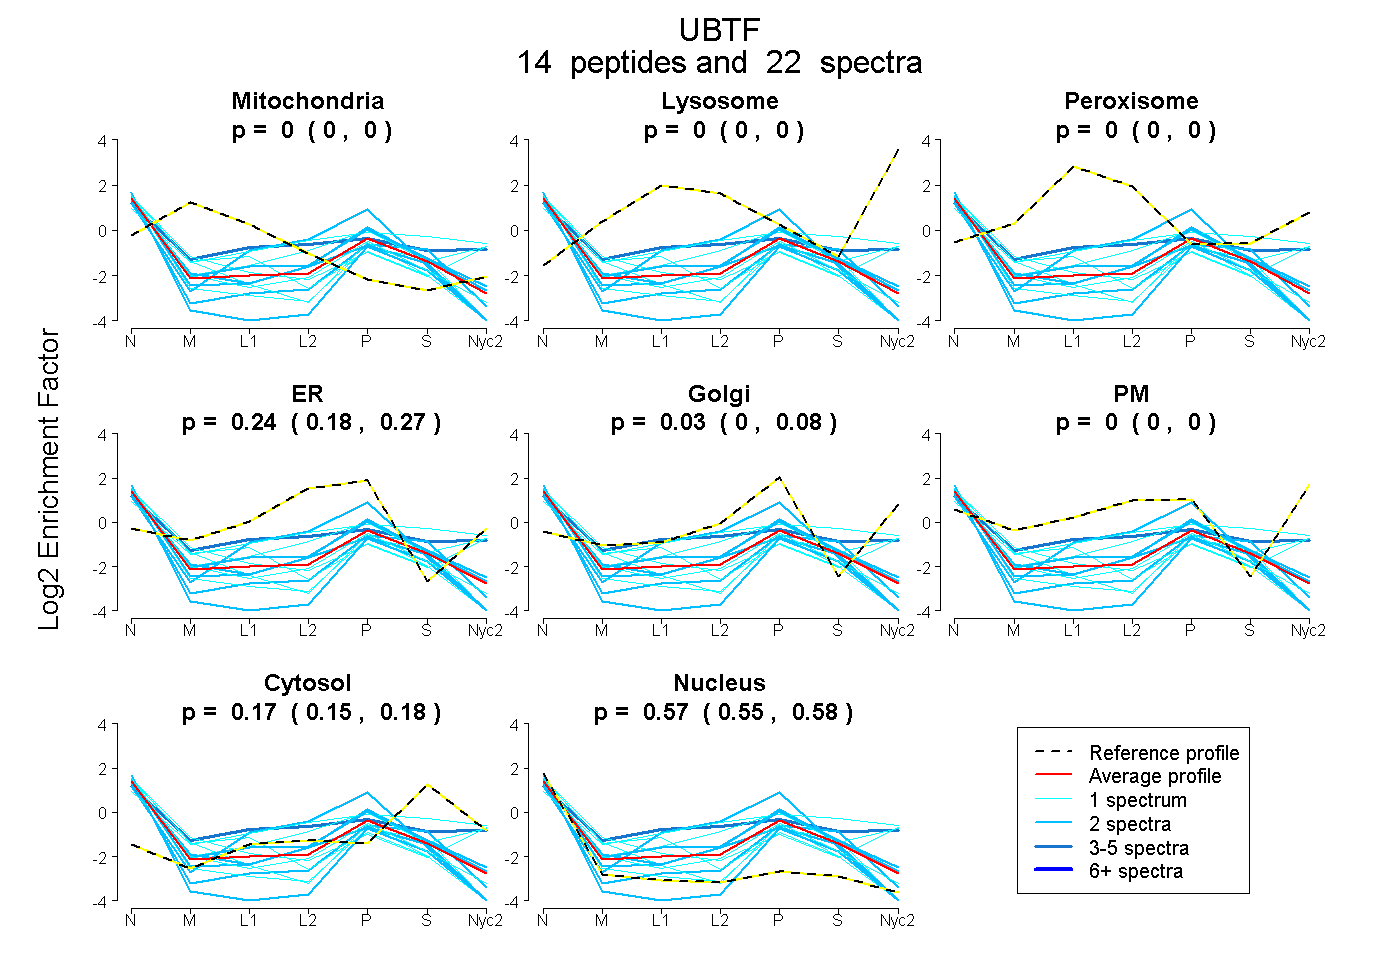
0.000 | 0.000
0.000 | 0.000
0.000 | 0.000
0.179 | 0.266
0.000 | 0.084
0.000 | 0.000
0.154 | 0.177
0.553 | 0.581
2peptides
spectra
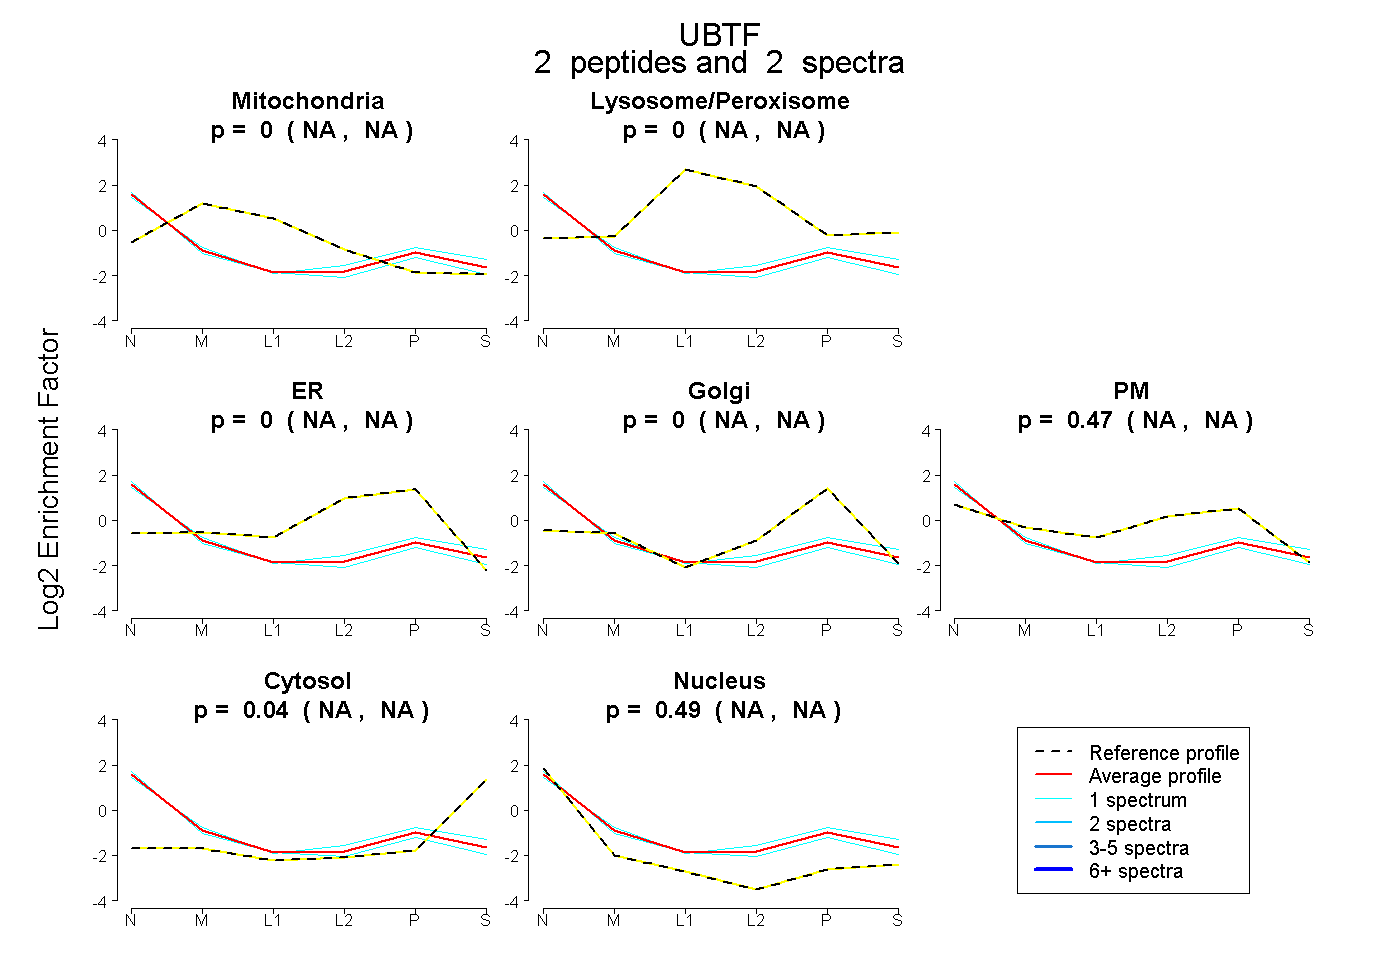
NA | NA
NA | NA
NA | NA
NA | NA
NA | NA
NA | NA
NA | NA
| Plot | Mito | Lyso | Perox | ER | Golgi | PM | Cytosol | Nucleus | |||||
| Expt A |
14 peptides |
22 spectra |
|
0.000 0.000 | 0.000 |
0.000 0.000 | 0.000 |
0.000 0.000 | 0.000 |
0.237 0.179 | 0.266 |
0.028 0.000 | 0.084 |
0.000 0.000 | 0.000 |
0.167 0.154 | 0.177 |
0.568 0.553 | 0.581 |
||
| Plot | Mito | Lyso or Perox | ER | Golgi | PM | Cytosol | Nucleus | ||||||
| Expt B |
2 peptides |
2 spectra |
|
0.000 NA | NA |
0.000 NA | NA |
0.000 NA | NA |
0.000 NA | NA |
0.474 NA | NA |
0.036 NA | NA |
0.490 NA | NA |
| 1 spectrum, FLESLPEEEQQR | 0.000 | 0.000 | 0.000 | 0.000 | 0.517 | 0.088 | 0.395 | |||
| 1 spectrum, LAEEQQR | 0.000 | 0.000 | 0.000 | 0.000 | 0.424 | 0.000 | 0.576 |
| Plot | Lyso | Other | |||||||||||
| Expt C |
2 peptides |
5 spectra |
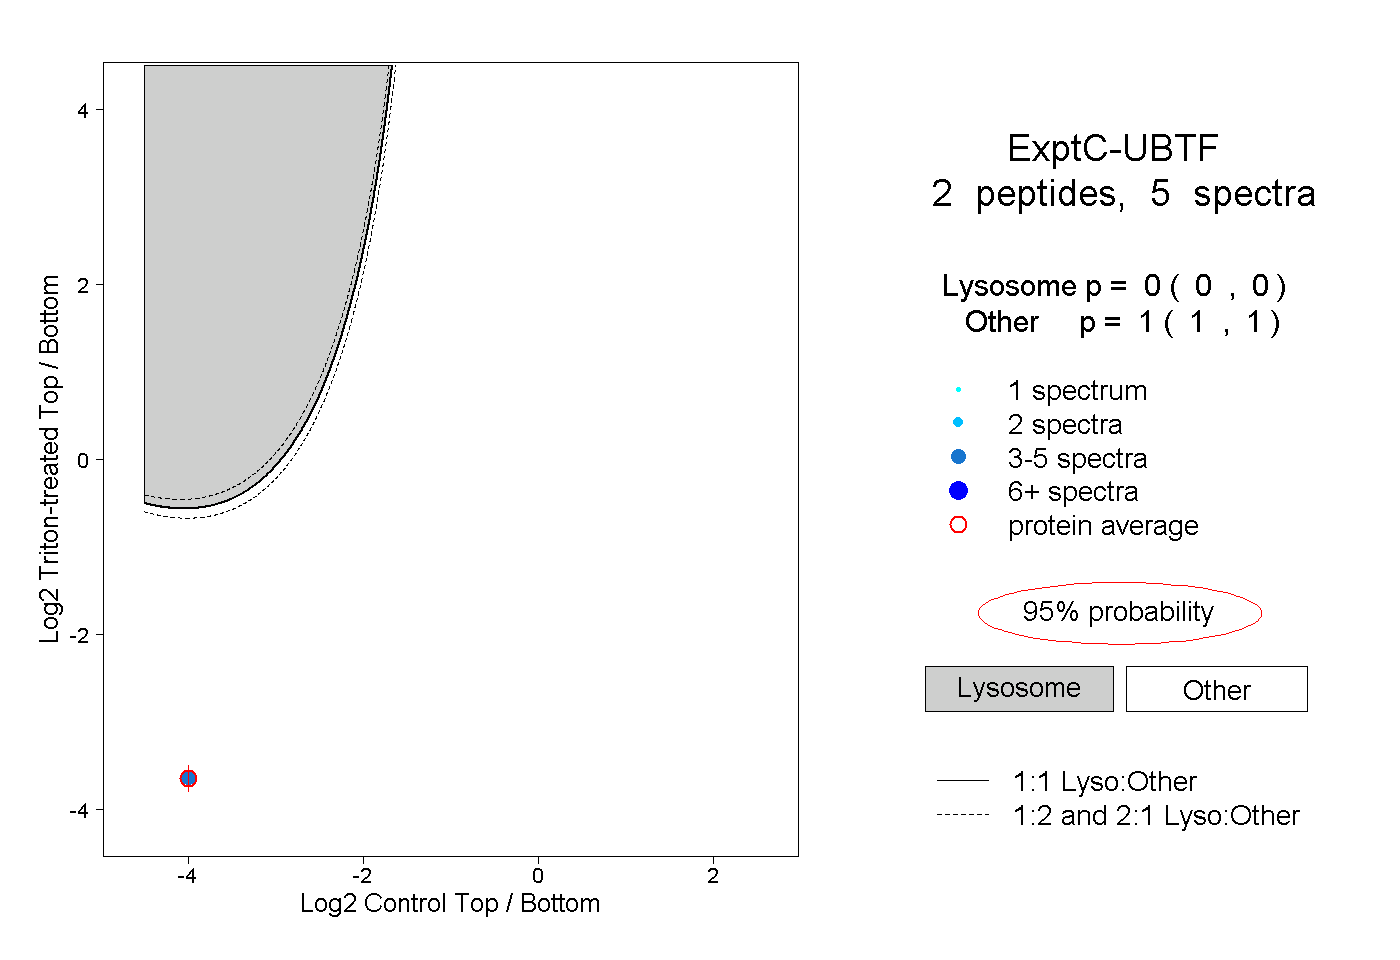 |
0.000 0.000 | 0.000 |
1.000 1.000 | 1.000 |