 14
14peptides
spectra
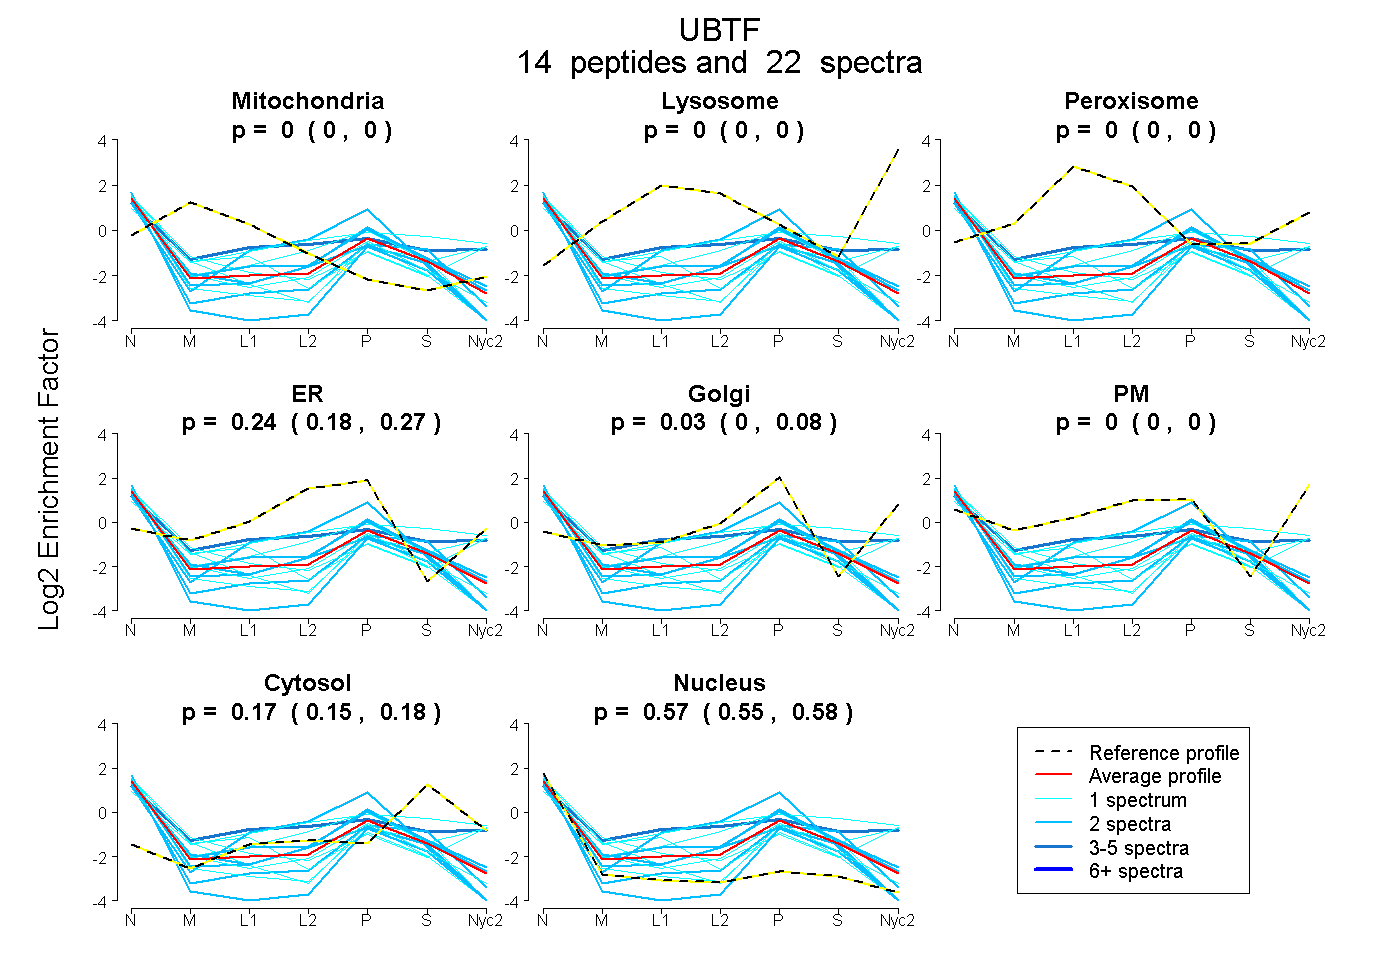
0.000 | 0.000
0.000 | 0.000
0.000 | 0.000
0.179 | 0.266
0.000 | 0.084
0.000 | 0.000
0.154 | 0.177
0.553 | 0.581
| Plot | Mito | Lyso | Perox | ER | Golgi | PM | Cytosol | Nucleus | |||||
| Expt A |
14 peptides |
22 spectra |
|
0.000 0.000 | 0.000 |
0.000 0.000 | 0.000 |
0.000 0.000 | 0.000 |
0.237 0.179 | 0.266 |
0.028 0.000 | 0.084 |
0.000 0.000 | 0.000 |
0.167 0.154 | 0.177 |
0.568 0.553 | 0.581 |
| 1 spectrum, FLESLPEEEQQR | 0.230 | 0.000 | 0.000 | 0.133 | 0.000 | 0.000 | 0.000 | 0.638 | ||
| 2 spectra, VHLDLWVK | 0.000 | 0.000 | 0.000 | 0.206 | 0.000 | 0.000 | 0.107 | 0.687 | ||
| 2 spectra, QLQEERPELSESELTR | 0.000 | 0.000 | 0.000 | 0.000 | 0.000 | 0.000 | 0.084 | 0.916 | ||
| 1 spectrum, ELPEK | 0.000 | 0.000 | 0.000 | 0.000 | 0.129 | 0.351 | 0.175 | 0.345 | ||
| 3 spectra, APPAATNSSK | 0.000 | 0.000 | 0.132 | 0.000 | 0.000 | 0.354 | 0.215 | 0.299 | ||
| 2 spectra, DVPSTER | 0.000 | 0.000 | 0.000 | 0.000 | 0.054 | 0.000 | 0.281 | 0.665 | ||
| 1 spectrum, KPSQEGGK | 0.000 | 0.000 | 0.000 | 0.000 | 0.044 | 0.000 | 0.181 | 0.775 | ||
| 2 spectra, KPLTPYFR | 0.000 | 0.000 | 0.000 | 0.213 | 0.117 | 0.000 | 0.146 | 0.523 | ||
| 1 spectrum, MVEIGSR | 0.000 | 0.019 | 0.000 | 0.000 | 0.000 | 0.392 | 0.058 | 0.530 | ||
| 1 spectrum, FFMEK | 0.102 | 0.000 | 0.000 | 0.000 | 0.150 | 0.000 | 0.000 | 0.748 | ||
| 2 spectra, VLGEEK | 0.000 | 0.000 | 0.000 | 0.334 | 0.006 | 0.000 | 0.180 | 0.480 | ||
| 2 spectra, HPELNISEEGITK | 0.000 | 0.000 | 0.000 | 0.487 | 0.000 | 0.000 | 0.033 | 0.480 | ||
| 1 spectrum, YIQDFQR | 0.000 | 0.000 | 0.000 | 0.204 | 0.044 | 0.000 | 0.075 | 0.677 | ||
| 1 spectrum, QTTSPASK | 0.000 | 0.000 | 0.038 | 0.012 | 0.000 | 0.391 | 0.381 | 0.178 |
| Plot | Mito | Lyso or Perox | ER | Golgi | PM | Cytosol | Nucleus | ||||||
| Expt B |
2 peptides |
2 spectra |
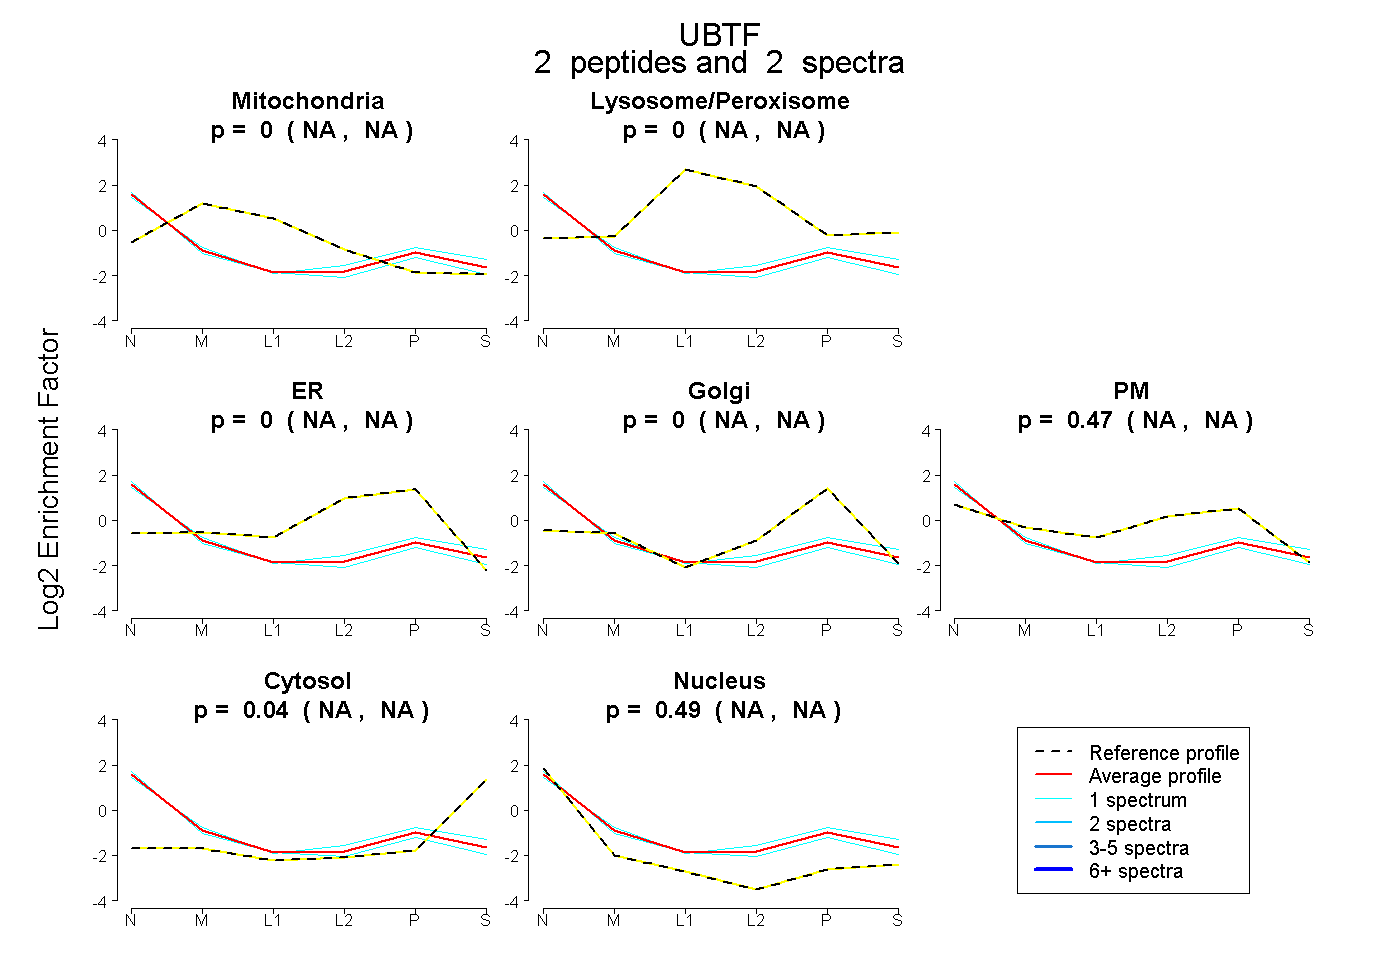 |
0.000 NA | NA |
0.000 NA | NA |
0.000 NA | NA |
0.000 NA | NA |
0.474 NA | NA |
0.036 NA | NA |
0.490 NA | NA |
|||
| Plot | Lyso | Other | |||||||||||
| Expt C |
2 peptides |
5 spectra |
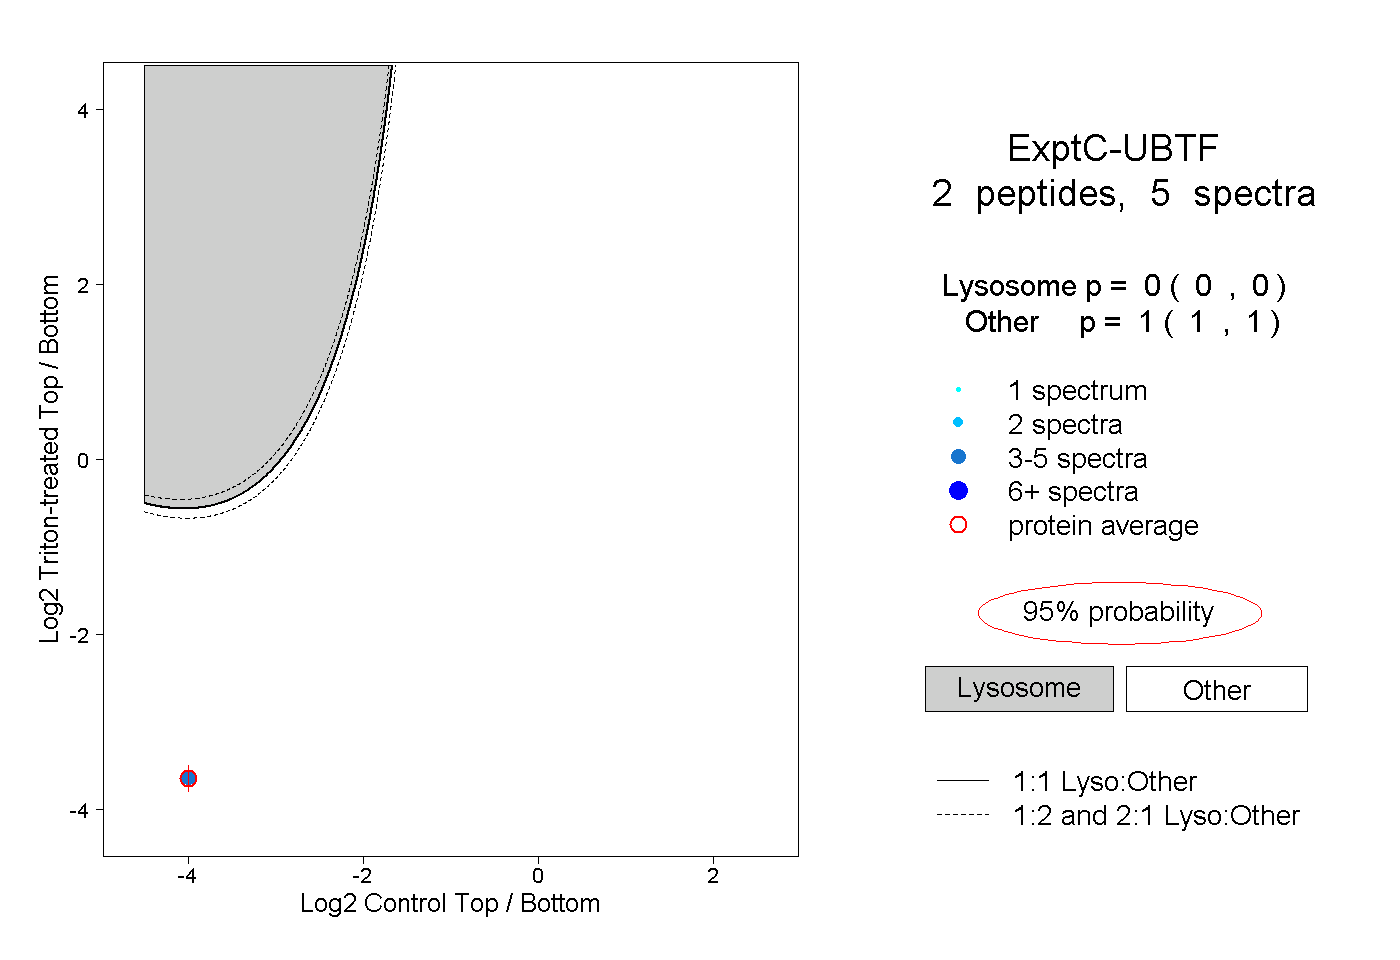 |
0.000 0.000 | 0.000 |
1.000 1.000 | 1.000 |