 2
2peptides
spectra
0.000 | 0.000
0.000 | 0.000
0.028 | 0.172
0.043 | 0.209
0.000 | 0.127
0.335 | 0.496
0.250 | 0.350
0.000 | 0.000
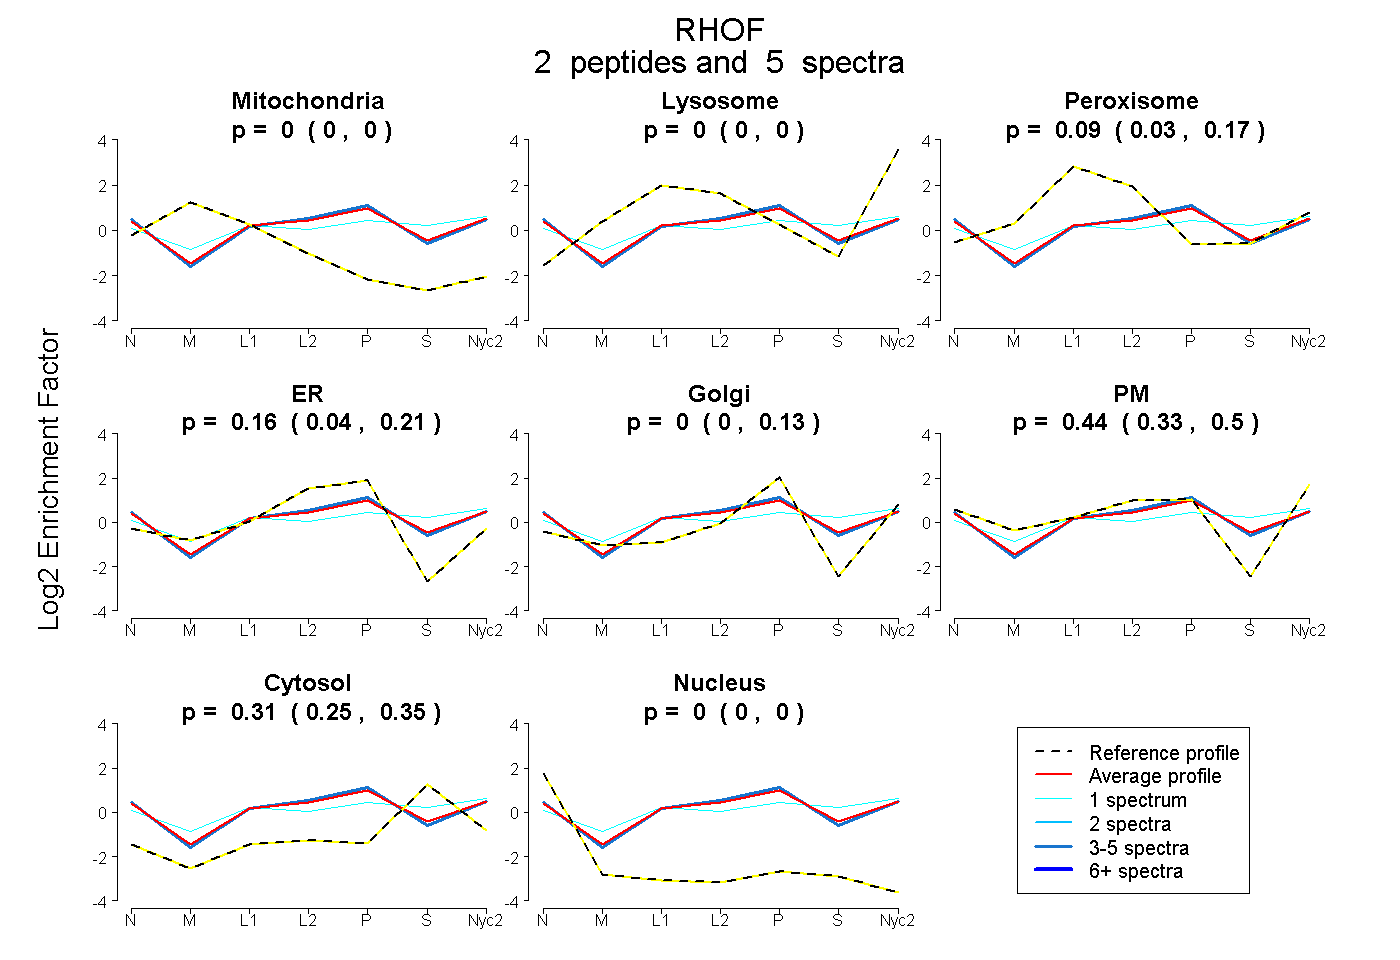
| Plot | Mito | Lyso | Perox | ER | Golgi | PM | Cytosol | Nucleus | |||||
| Expt A |
2 peptides |
5 spectra |
|
0.000 0.000 | 0.000 |
0.000 0.000 | 0.000 |
0.085 0.028 | 0.172 |
0.158 0.043 | 0.209 |
0.000 0.000 | 0.127 |
0.442 0.335 | 0.496 |
0.315 0.250 | 0.350 |
0.000 0.000 | 0.000 |
| 1 spectrum, IVIVGDGGCGK | 0.000 | 0.000 | 0.214 | 0.000 | 0.031 | 0.371 | 0.385 | 0.000 | ||
| 4 spectra, WFPEVTHFCR | 0.000 | 0.000 | 0.056 | 0.219 | 0.000 | 0.431 | 0.293 | 0.000 |
| Plot | Lyso | Other | |||||||||||
| Expt C |
2 peptides |
4 spectra |
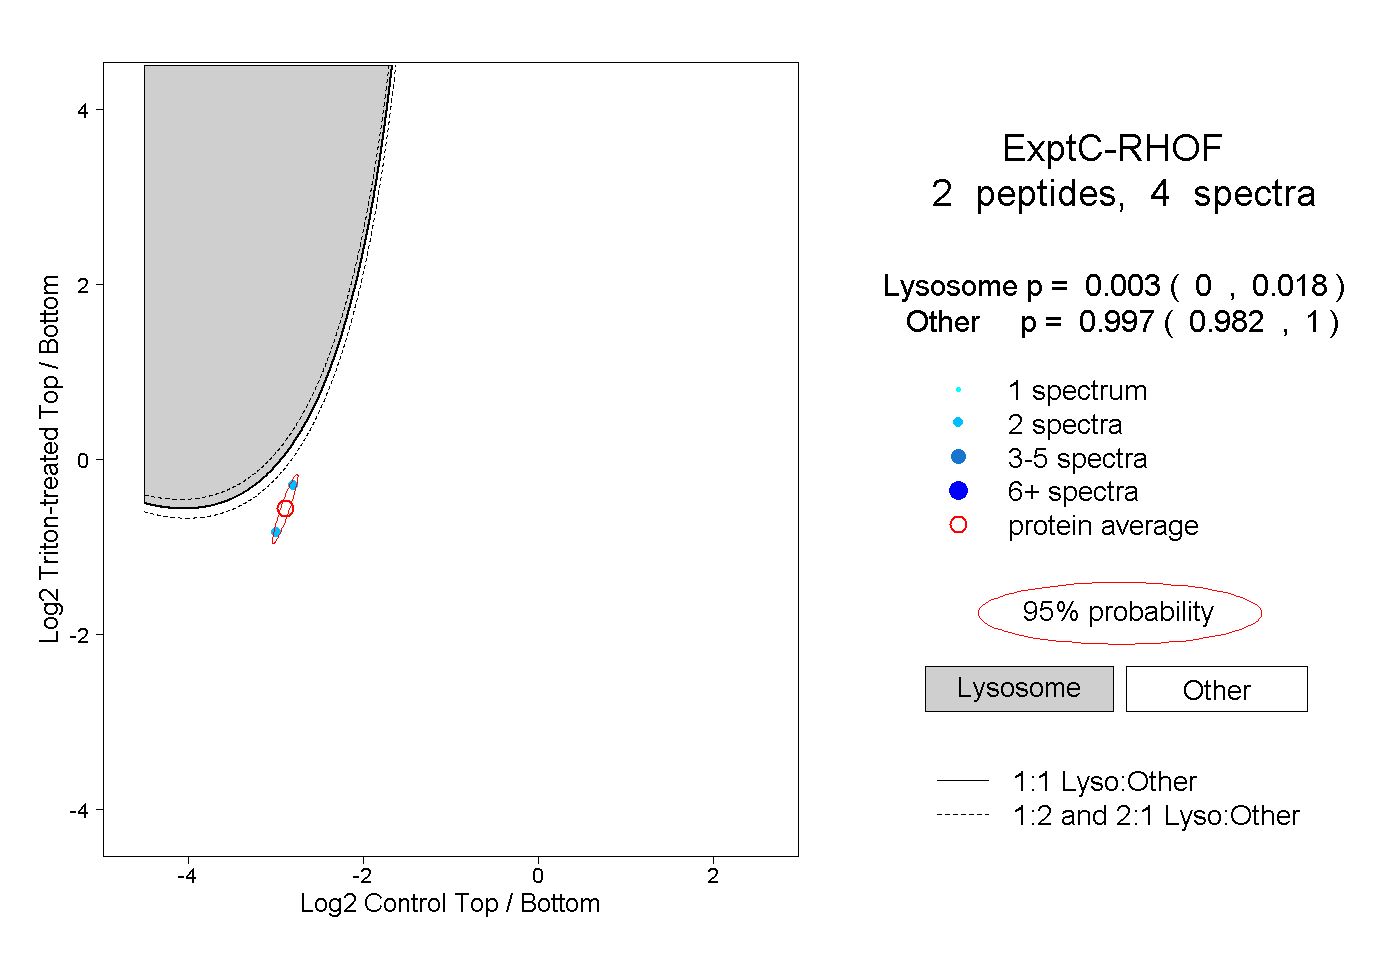 |
0.003 0.000 | 0.018 |
0.997 0.982 | 1.000 |