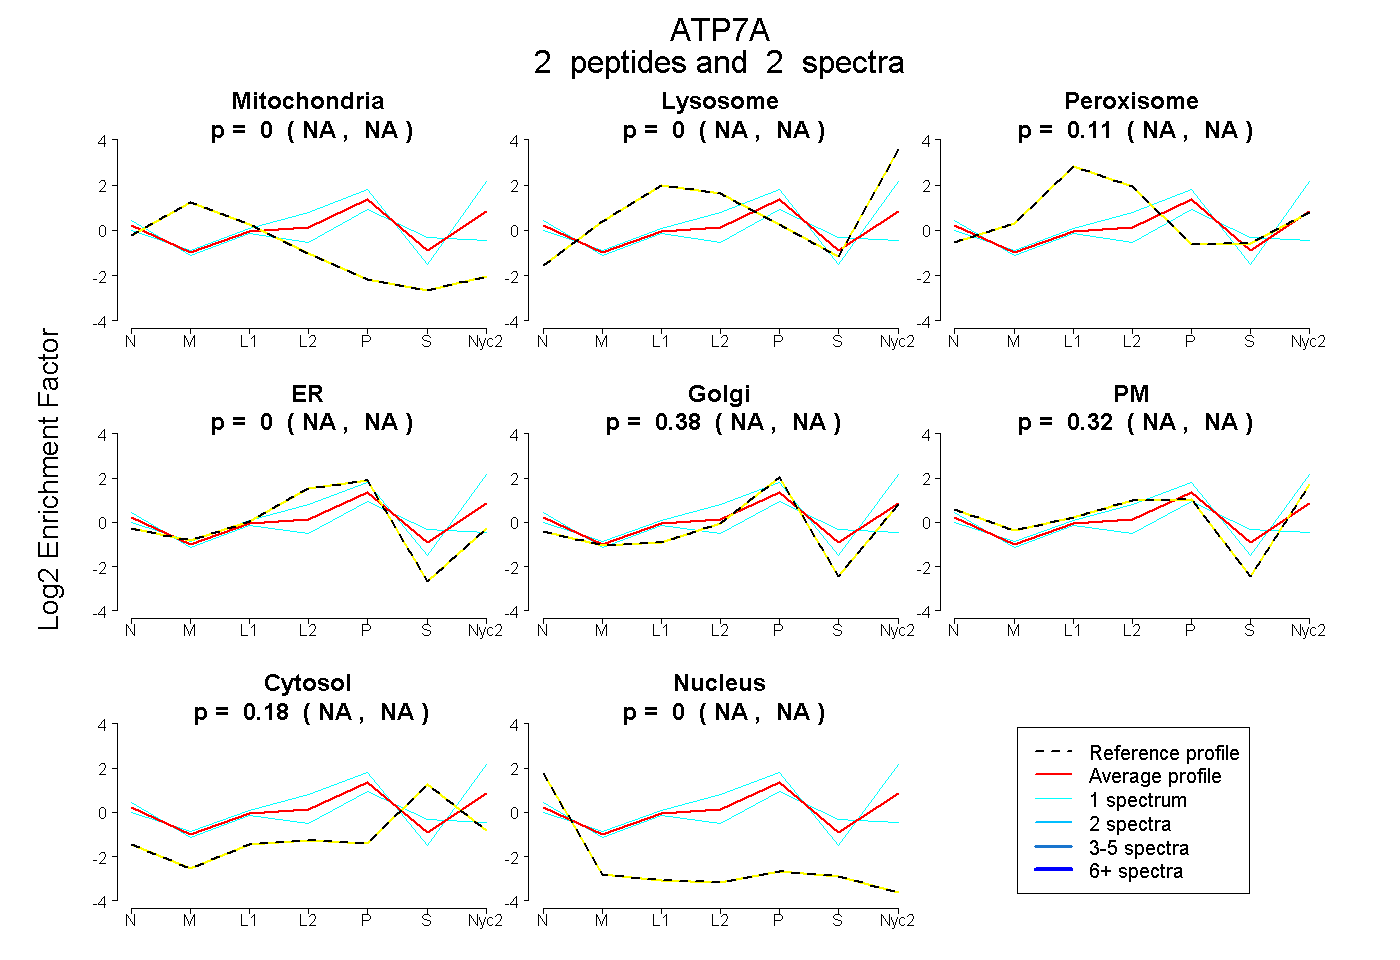
 2
2peptides
spectra
NA | NA
NA | NA
NA | NA
NA | NA
NA | NA
NA | NA
NA | NA
NA | NA
| Plot | Mito | Lyso | Perox | ER | Golgi | PM | Cytosol | Nucleus | |||||
| Expt A |
2 peptides |
2 spectra |
|
0.000 NA | NA |
0.000 NA | NA |
0.113 NA | NA |
0.000 NA | NA |
0.384 NA | NA |
0.320 NA | NA |
0.182 NA | NA |
0.000 NA | NA |
| 1 spectrum, STGILETVSIR | 0.000 | 0.000 | 0.201 | 0.046 | 0.399 | 0.000 | 0.270 | 0.084 | ||
| 1 spectrum, VLIGNR | 0.000 | 0.249 | 0.000 | 0.000 | 0.447 | 0.301 | 0.003 | 0.000 |
| Plot | Lyso | Other | |||||||||||
| Expt C |
3 peptides |
4 spectra |
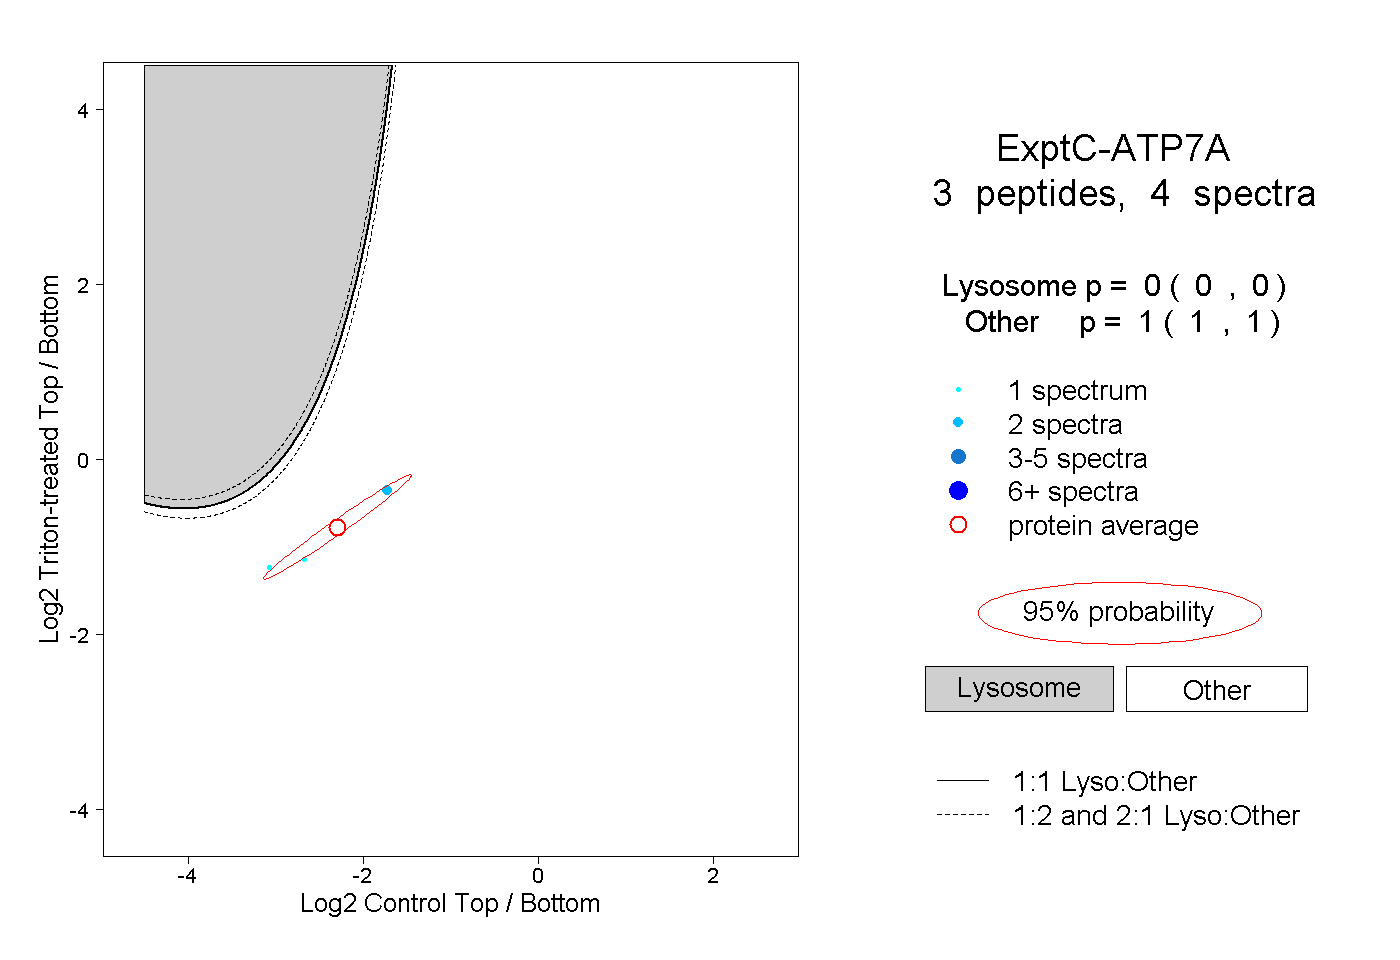 |
0.000 0.000 | 0.000 |
1.000 1.000 | 1.000 |