 6
6peptides
spectra
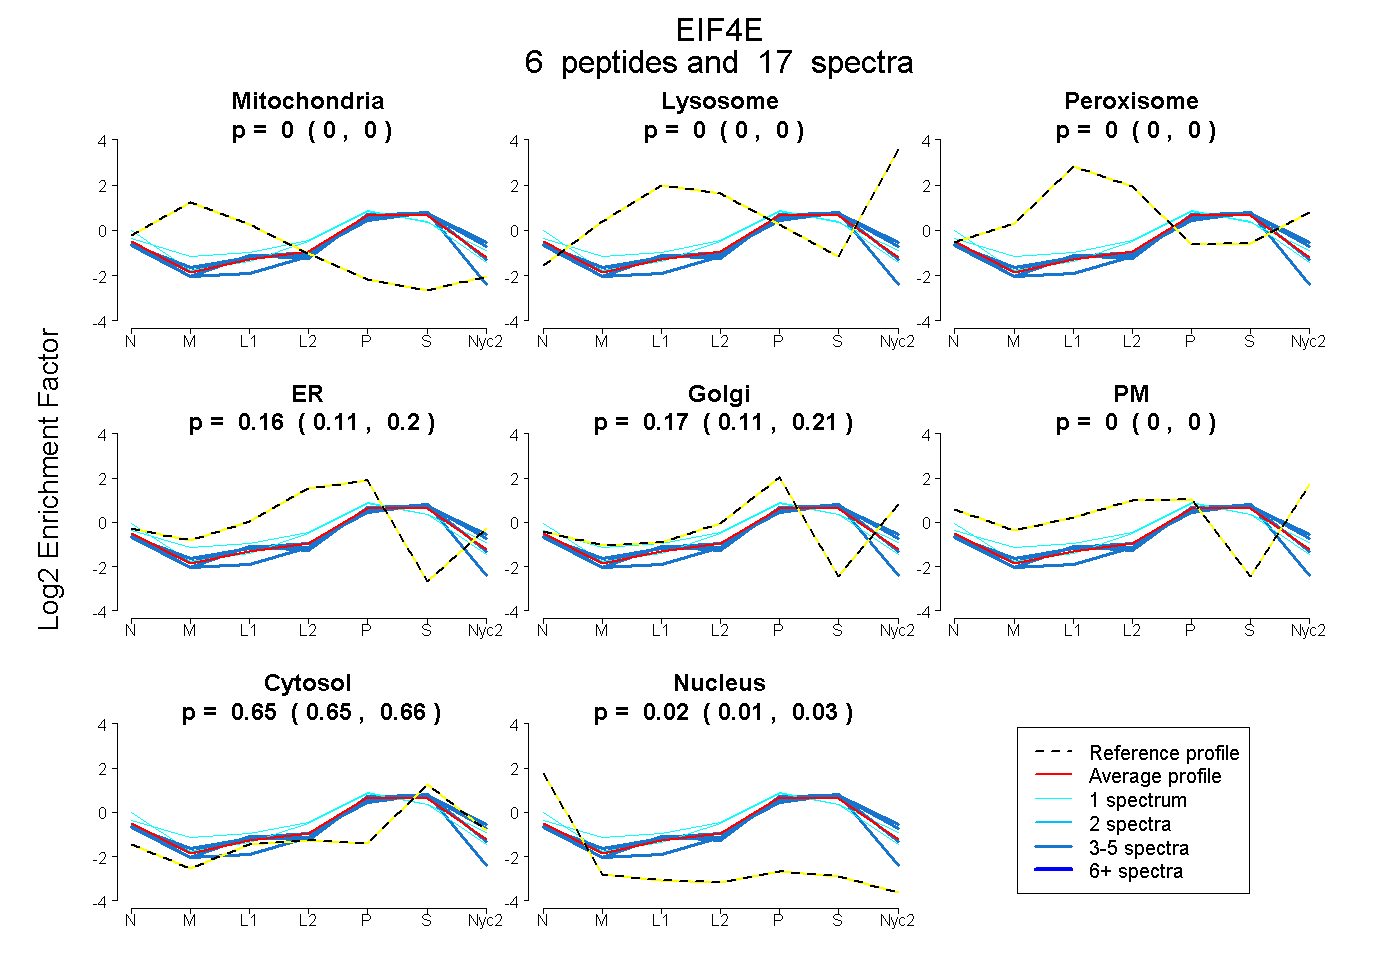
0.000 | 0.000
0.000 | 0.000
0.000 | 0.000
0.111 | 0.195
0.111 | 0.212
0.000 | 0.000
0.645 | 0.662
0.011 | 0.034
2peptides
spectra
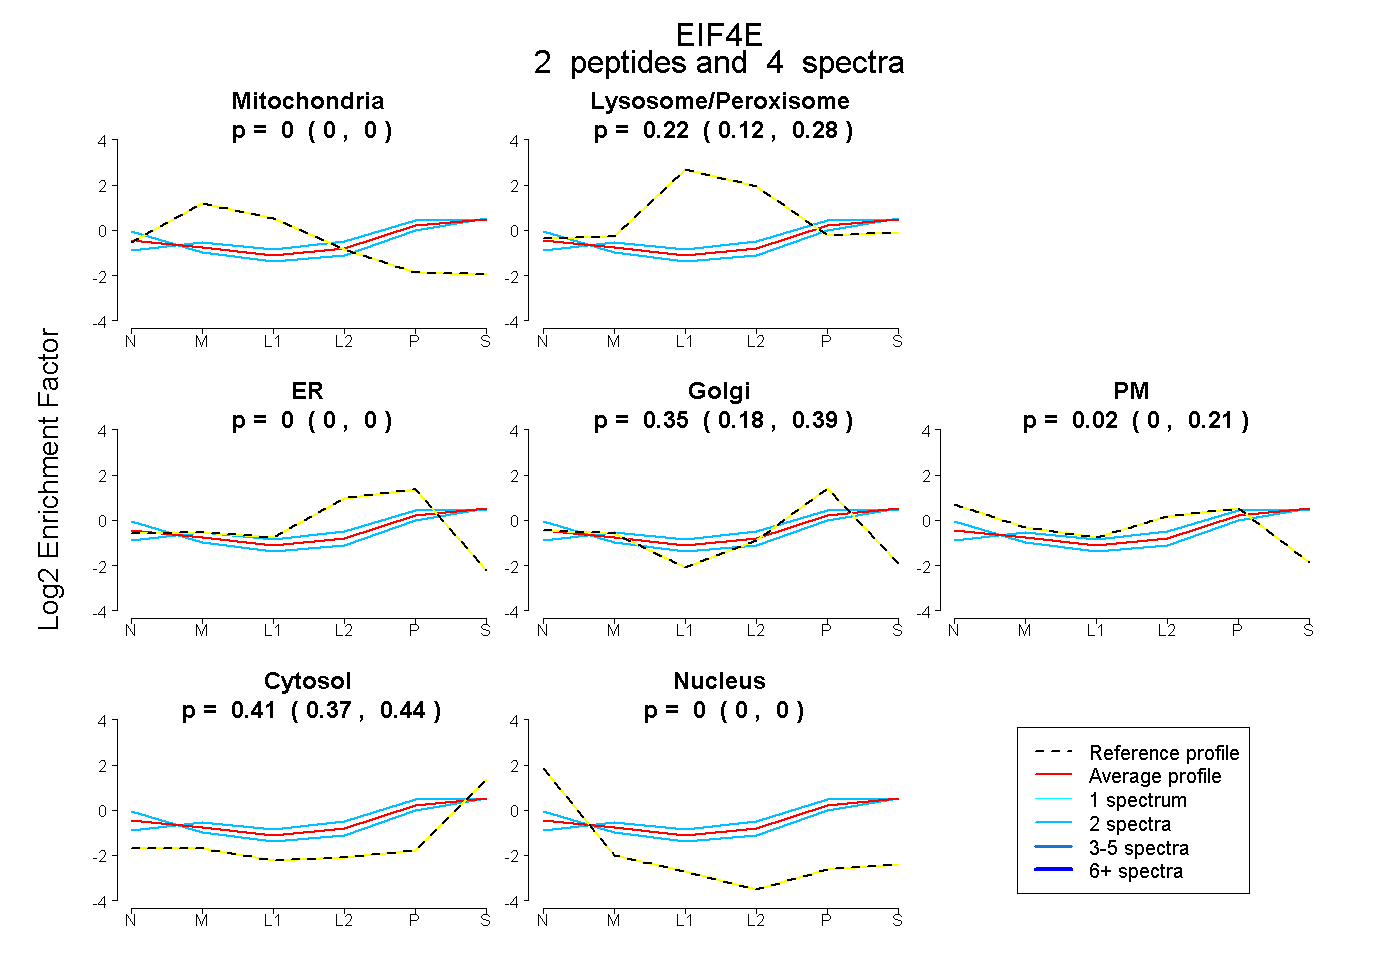
0.000 | 0.000
0.117 | 0.276
0.000 | 0.000
0.184 | 0.385
0.000 | 0.212
0.371 | 0.442
0.000 | 0.000
7peptides
spectra
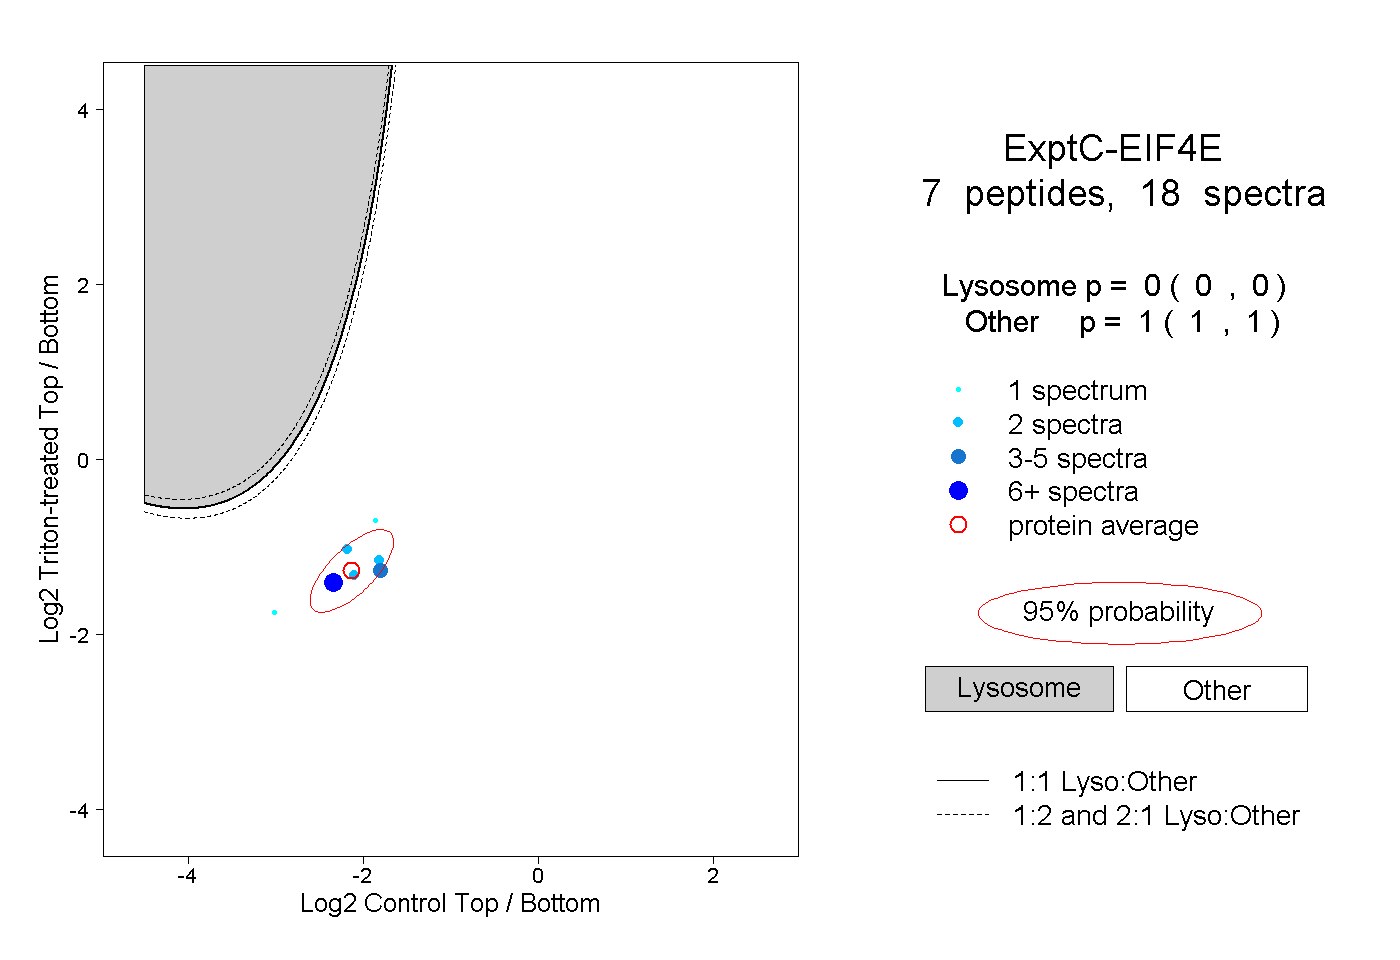
0.000 | 0.000
1.000 | 1.000
1peptide
spectrum
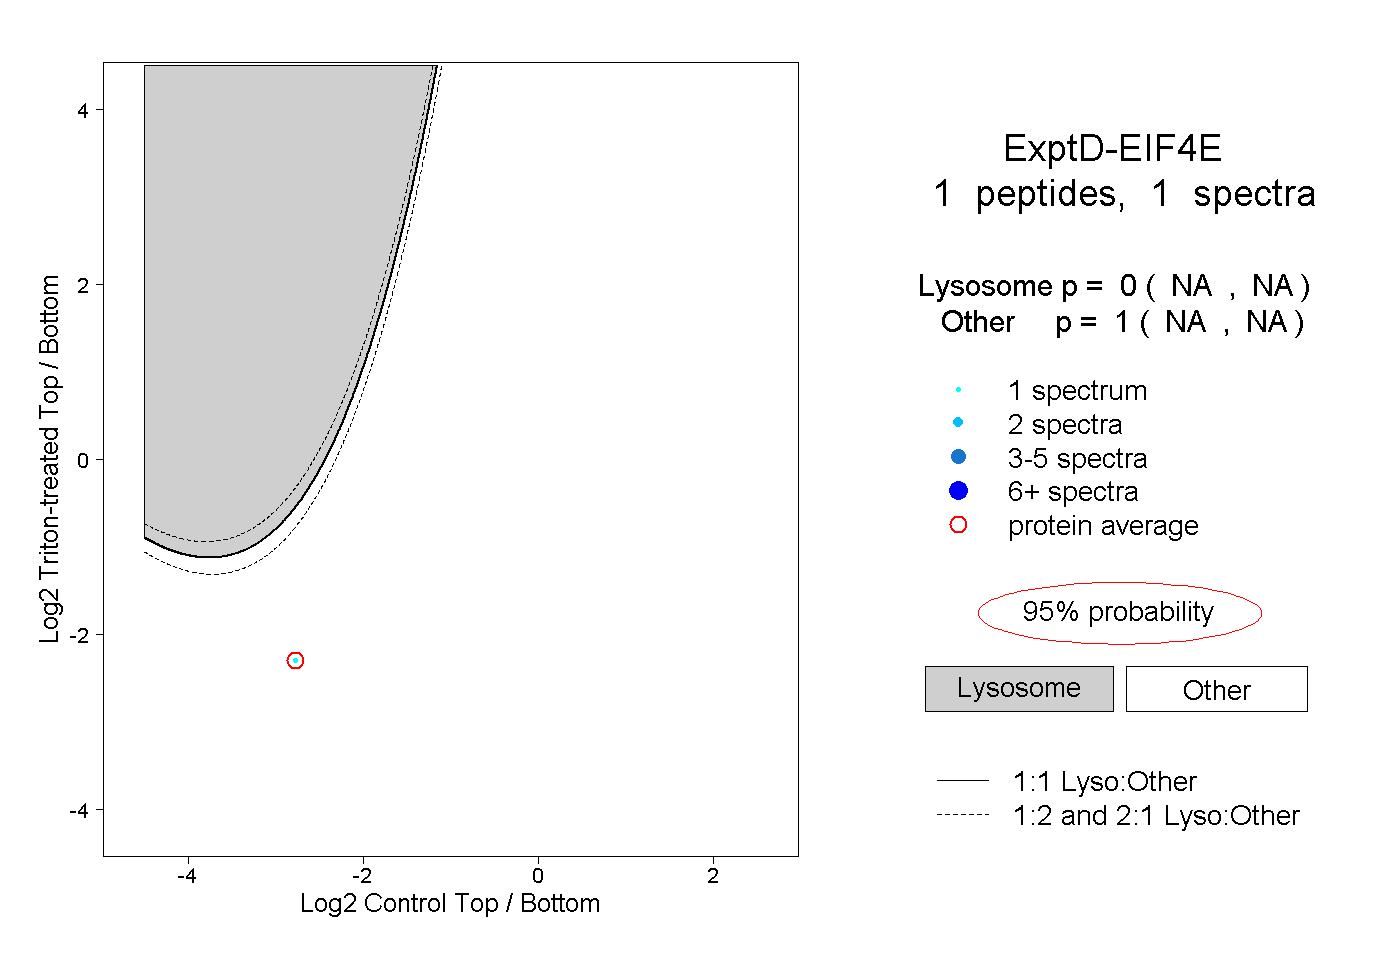
NA | NA
NA | NA