 8
8peptides
spectra
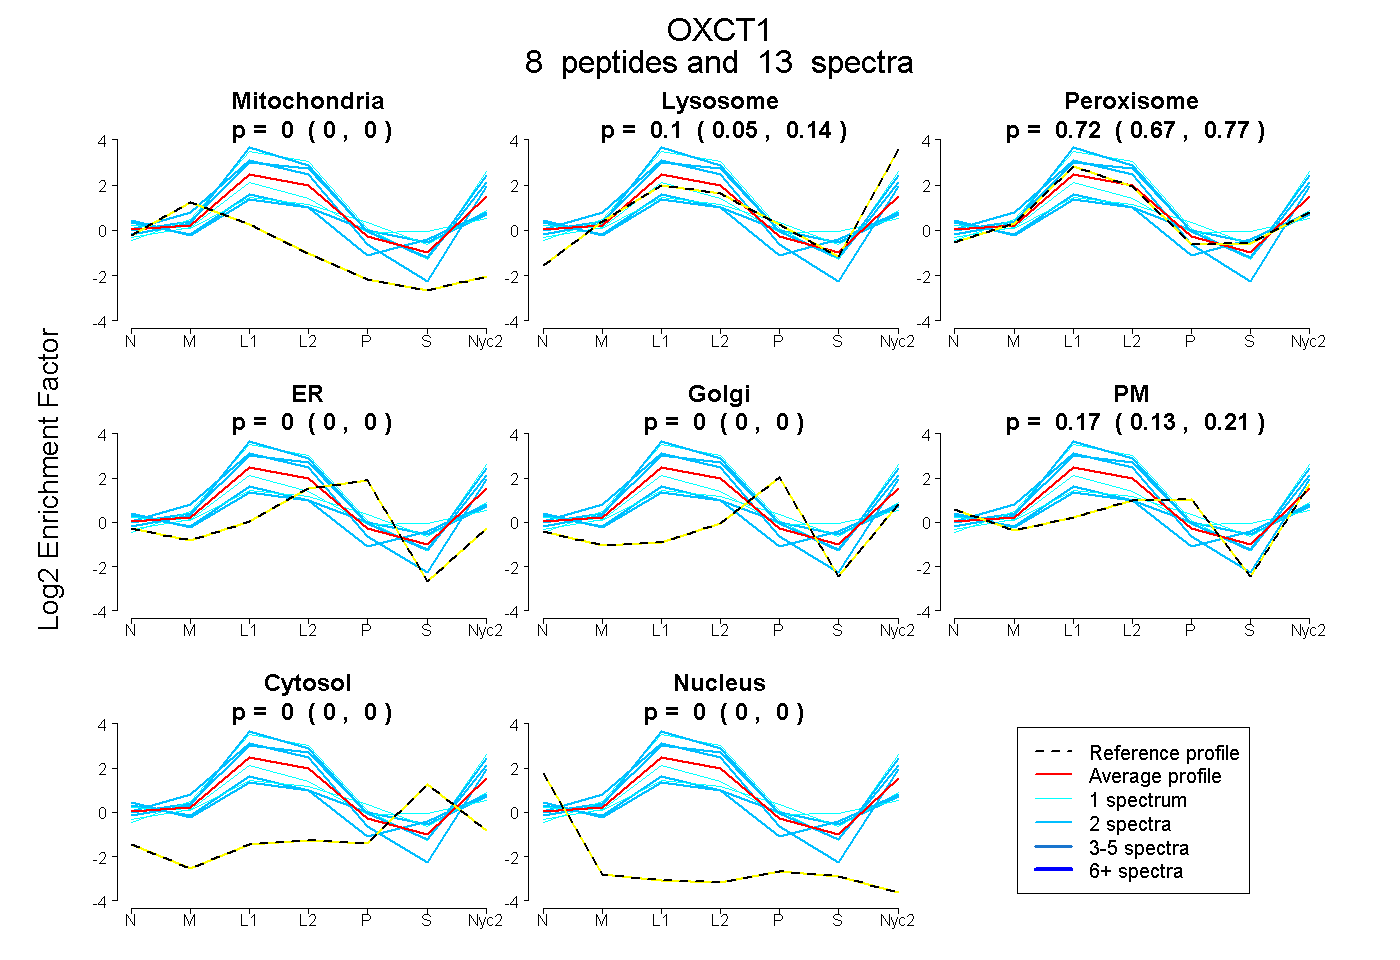
0.000 | 0.000
0.052 | 0.144
0.670 | 0.766
0.000 | 0.000
0.000 | 0.000
0.133 | 0.206
0.000 | 0.000
0.000 | 0.000
| Plot | Mito | Lyso | Perox | ER | Golgi | PM | Cytosol | Nucleus | |||||
| Expt A |
8 peptides |
13 spectra |
|
0.000 0.000 | 0.000 |
0.103 0.052 | 0.144 |
0.723 0.670 | 0.766 |
0.000 0.000 | 0.000 |
0.000 0.000 | 0.000 |
0.173 0.133 | 0.206 |
0.000 0.000 | 0.000 |
0.000 0.000 | 0.000 |
| 2 spectra, GGHVNLTMLGAMQVSK | 0.000 | 0.000 | 0.589 | 0.000 | 0.000 | 0.281 | 0.102 | 0.028 | ||
| 2 spectra, MISSYVGENAEFER | 0.000 | 0.025 | 0.671 | 0.000 | 0.000 | 0.107 | 0.099 | 0.098 | ||
| 1 spectrum, FYTDPVEAVK | 0.000 | 0.480 | 0.520 | 0.000 | 0.000 | 0.000 | 0.000 | 0.000 | ||
| 1 spectrum, GMGGAMDLVSSSK | 0.000 | 0.000 | 0.532 | 0.000 | 0.006 | 0.372 | 0.090 | 0.000 | ||
| 2 spectra, DGSVAIASKPR | 0.000 | 0.326 | 0.643 | 0.000 | 0.000 | 0.031 | 0.000 | 0.000 | ||
| 1 spectrum, GQHFILEEAITGDFALVK | 0.000 | 0.000 | 0.827 | 0.000 | 0.073 | 0.000 | 0.100 | 0.000 | ||
| 2 spectra, AGNVIFR | 0.000 | 0.242 | 0.658 | 0.000 | 0.000 | 0.100 | 0.000 | 0.000 | ||
| 2 spectra, VVVTMEHSAK | 0.000 | 0.379 | 0.621 | 0.000 | 0.000 | 0.000 | 0.000 | 0.000 |
| Plot | Mito | Lyso or Perox | ER | Golgi | PM | Cytosol | Nucleus | ||||||
| Expt B |
1 peptide |
1 spectrum |
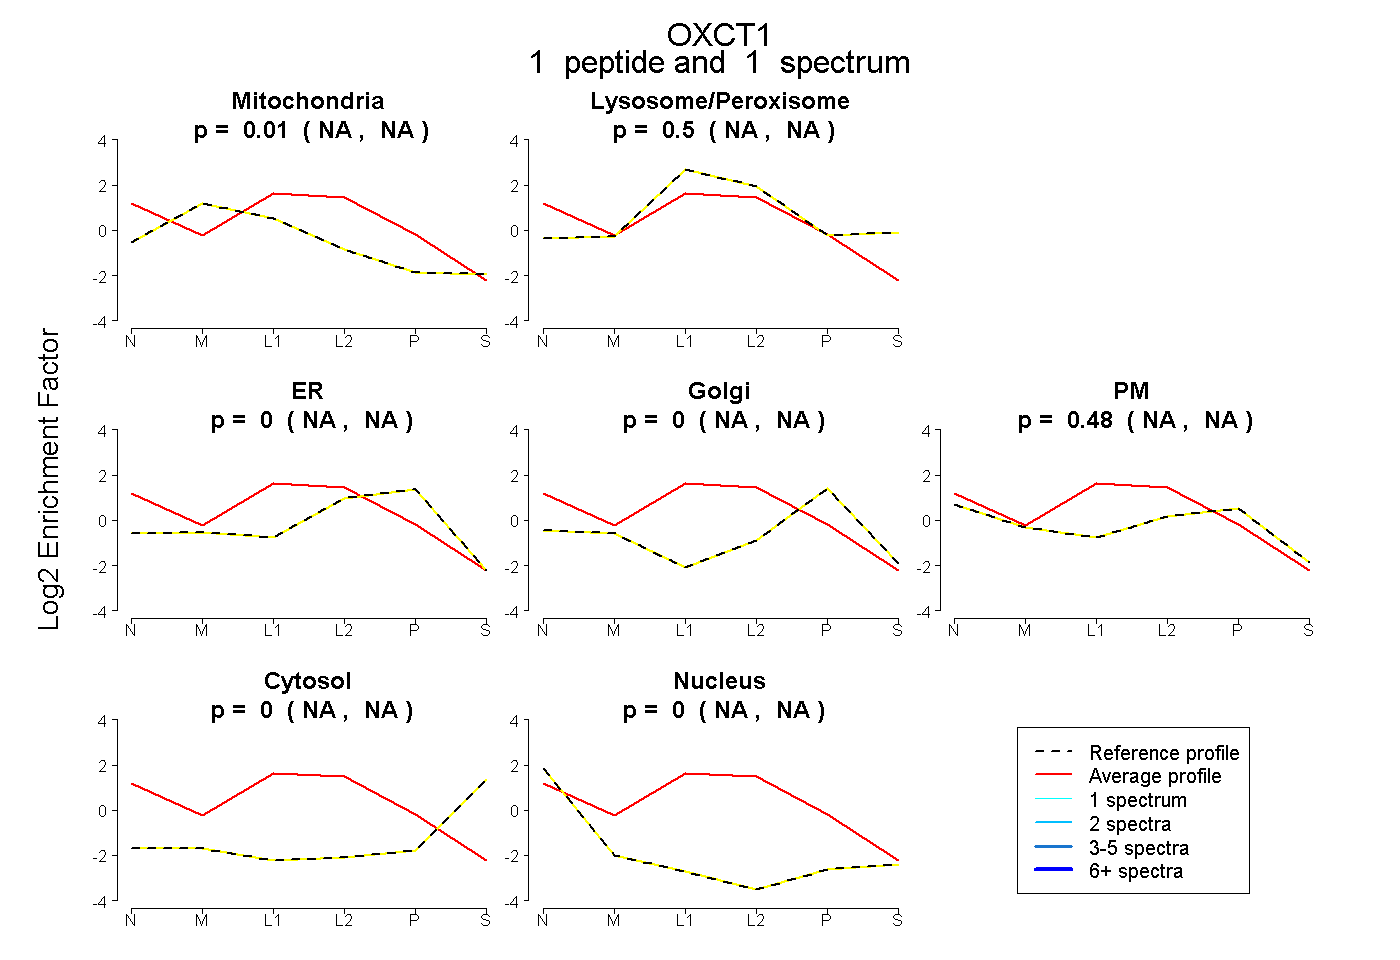 |
0.014 NA | NA |
0.502 NA | NA |
0.000 NA | NA |
0.000 NA | NA |
0.484 NA | NA |
0.000 NA | NA |
0.000 NA | NA |
|||
| Plot | Lyso | Other | |||||||||||
| Expt C |
13 peptides |
94 spectra |
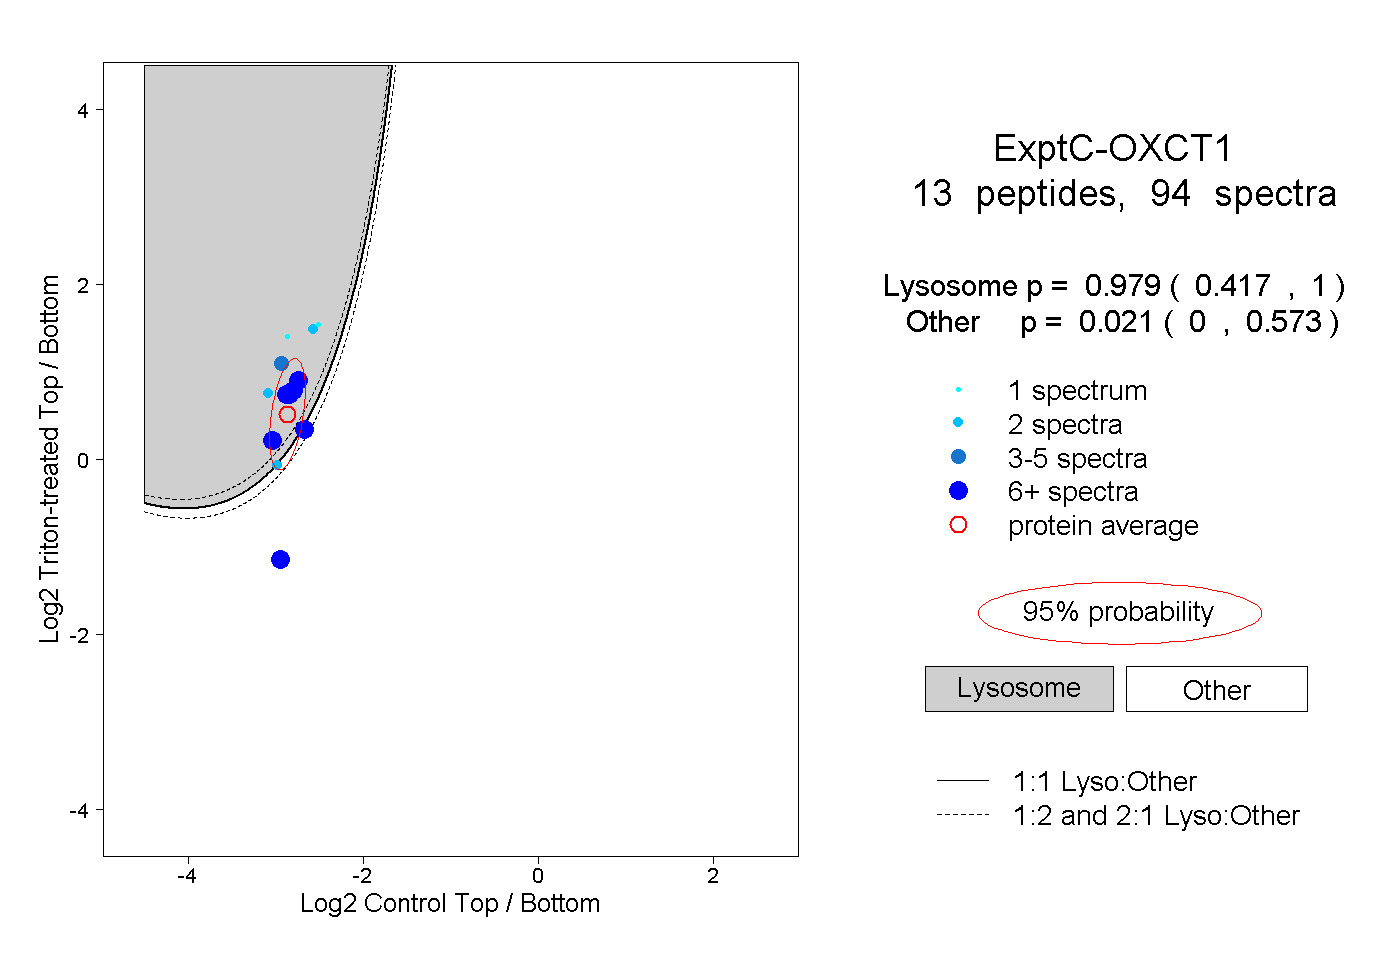 |
0.979 0.417 | 1.000 |
0.021 0.000 | 0.573 |
||||||||
| Plot | Lyso | Other | |||||||||||
| Expt D |
3 peptides |
10 spectra |
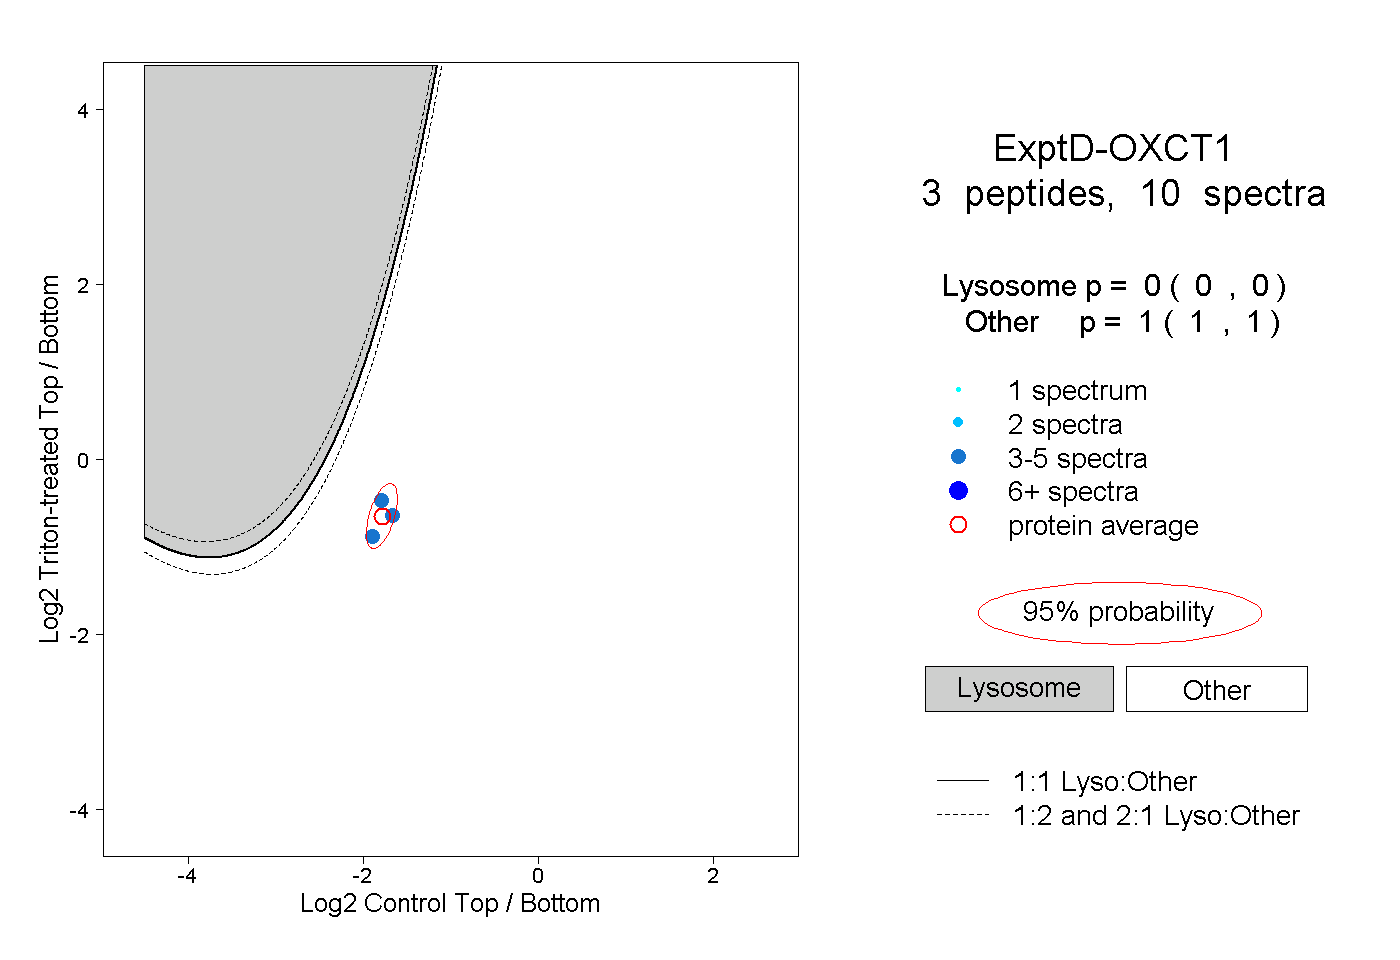 |
0.000 0.000 | 0.000 |
1.000 1.000 | 1.000 |