 1
1peptide
spectra
0.677 | 0.779
0.000 | 0.000
0.000 | 0.124
0.000 | 0.212
0.000 | 0.134
0.000 | 0.156
0.000 | 0.009
0.000 | 0.012
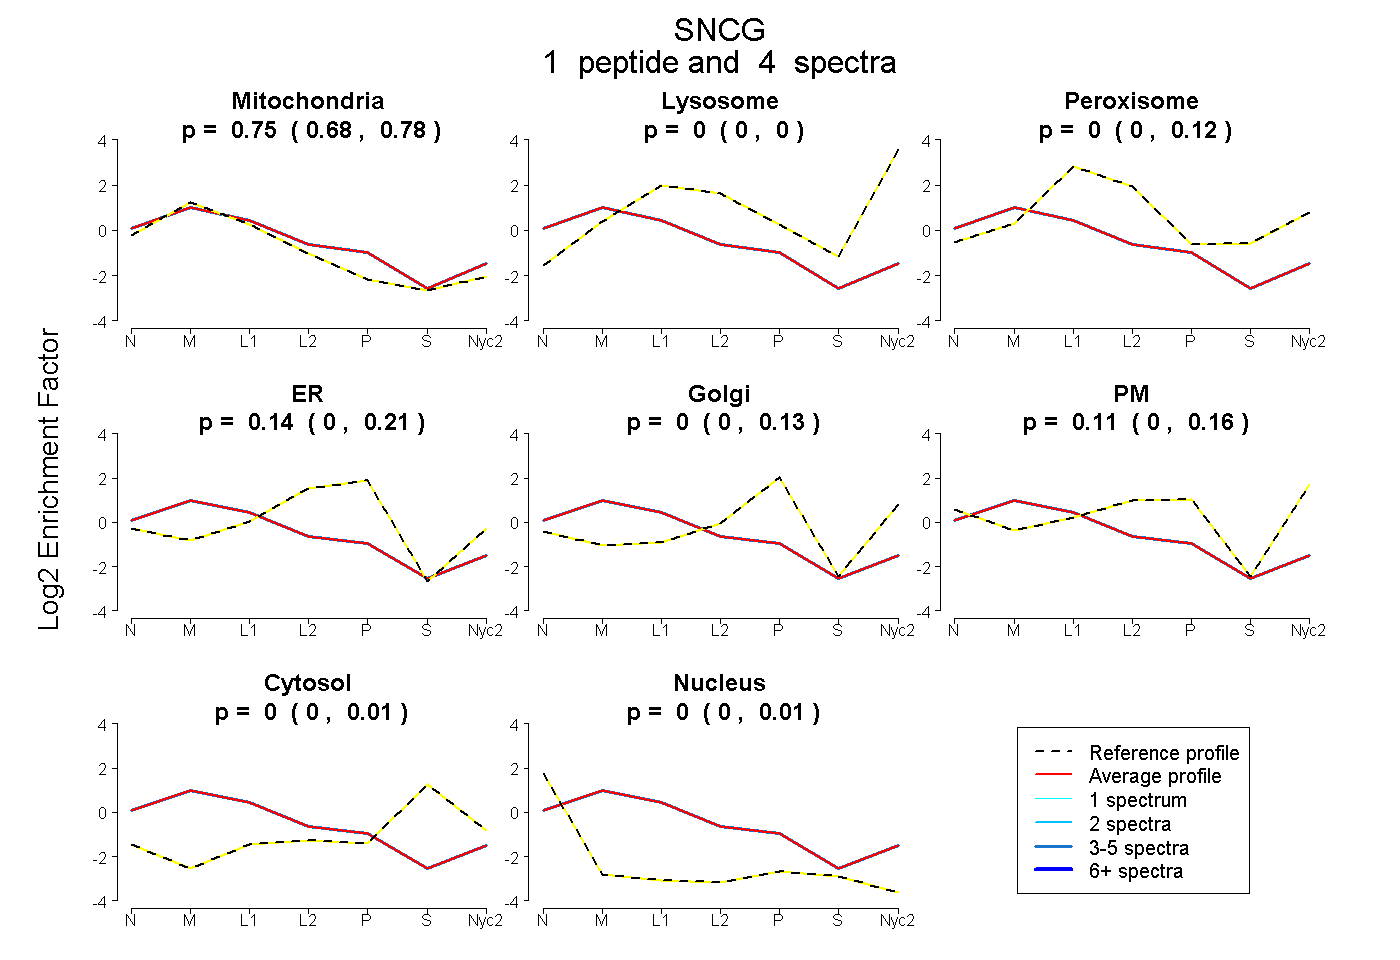
| Plot | Mito | Lyso | Perox | ER | Golgi | PM | Cytosol | Nucleus | |||||
| Expt A |
1 peptide |
4 spectra |
|
0.748 0.677 | 0.779 |
0.000 0.000 | 0.000 |
0.002 0.000 | 0.124 |
0.138 0.000 | 0.212 |
0.000 0.000 | 0.134 |
0.113 0.000 | 0.156 |
0.000 0.000 | 0.009 |
0.000 0.000 | 0.012 |