 7
7peptides
spectra
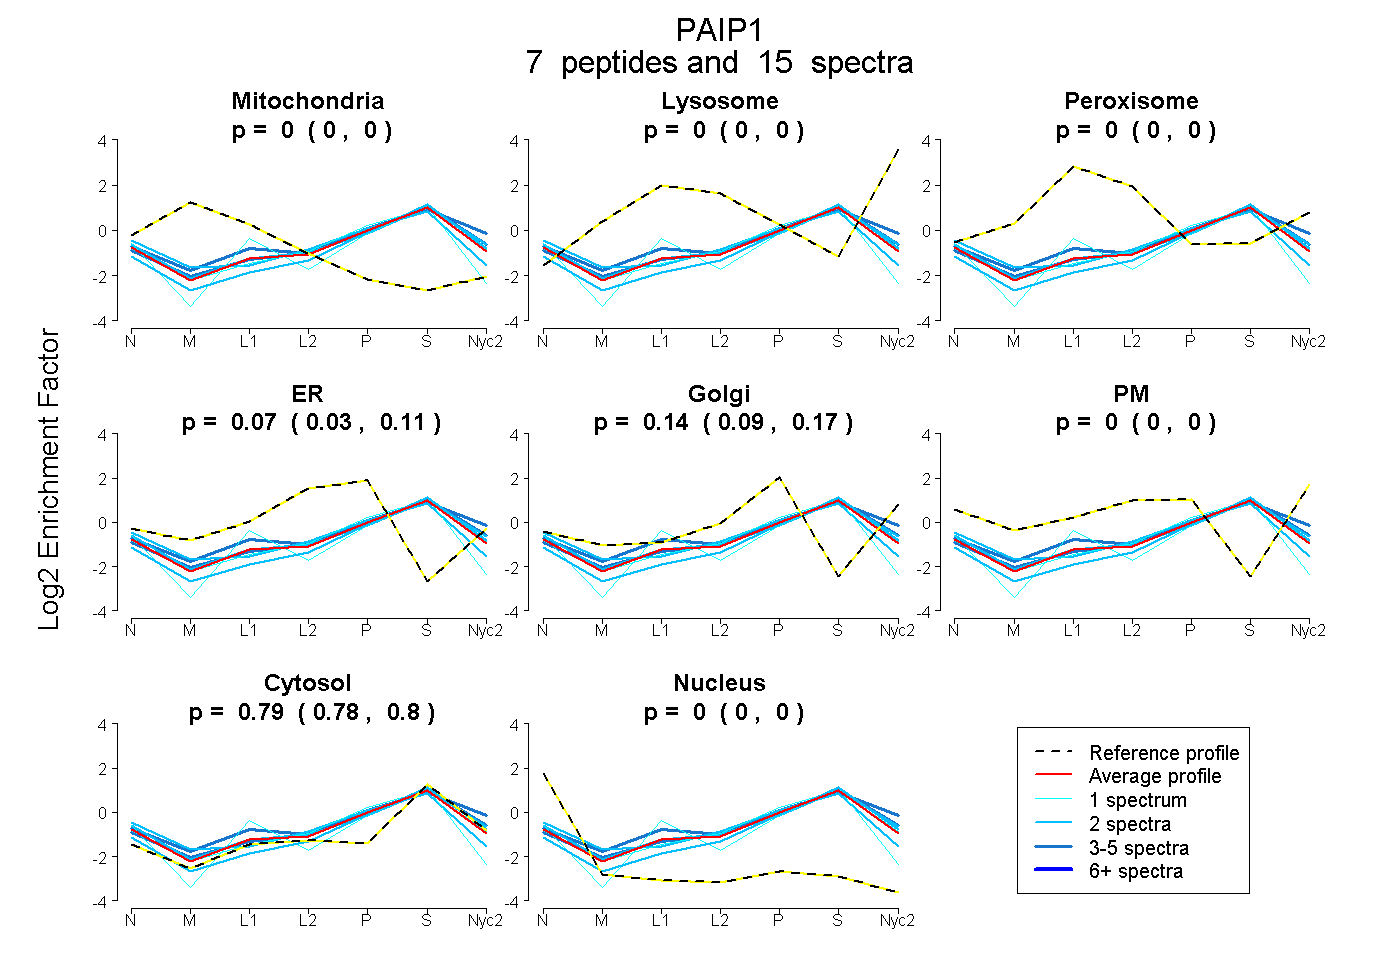
0.000 | 0.000
0.000 | 0.000
0.000 | 0.000
0.034 | 0.107
0.090 | 0.175
0.000 | 0.000
0.779 | 0.797
0.000 | 0.003
3peptides
spectra
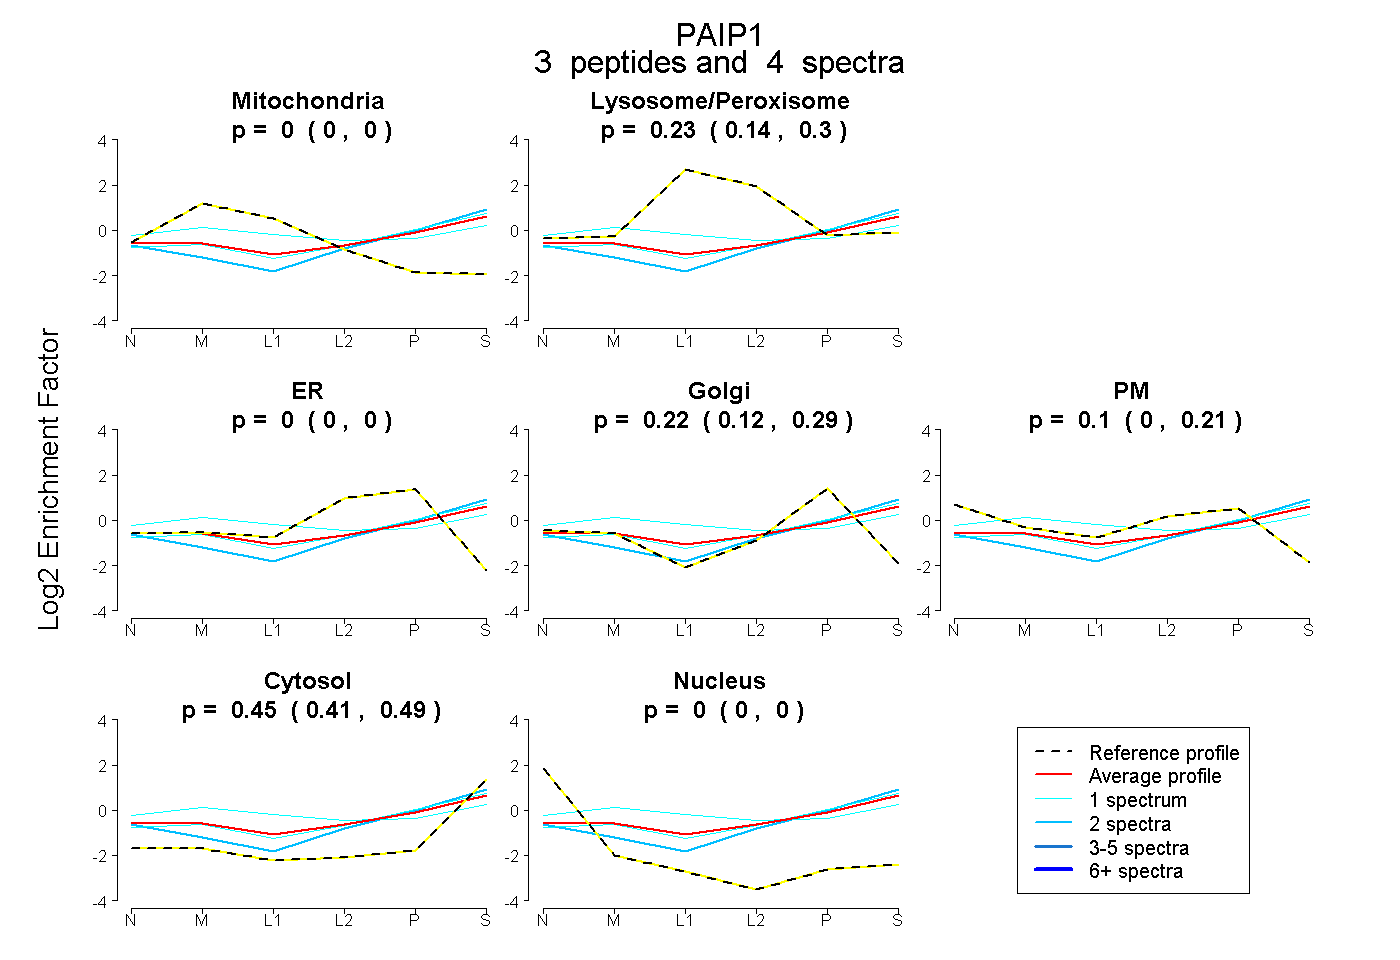
0.000 | 0.000
0.140 | 0.298
0.000 | 0.000
0.124 | 0.285
0.000 | 0.209
0.412 | 0.490
0.000 | 0.000
5peptides
spectra
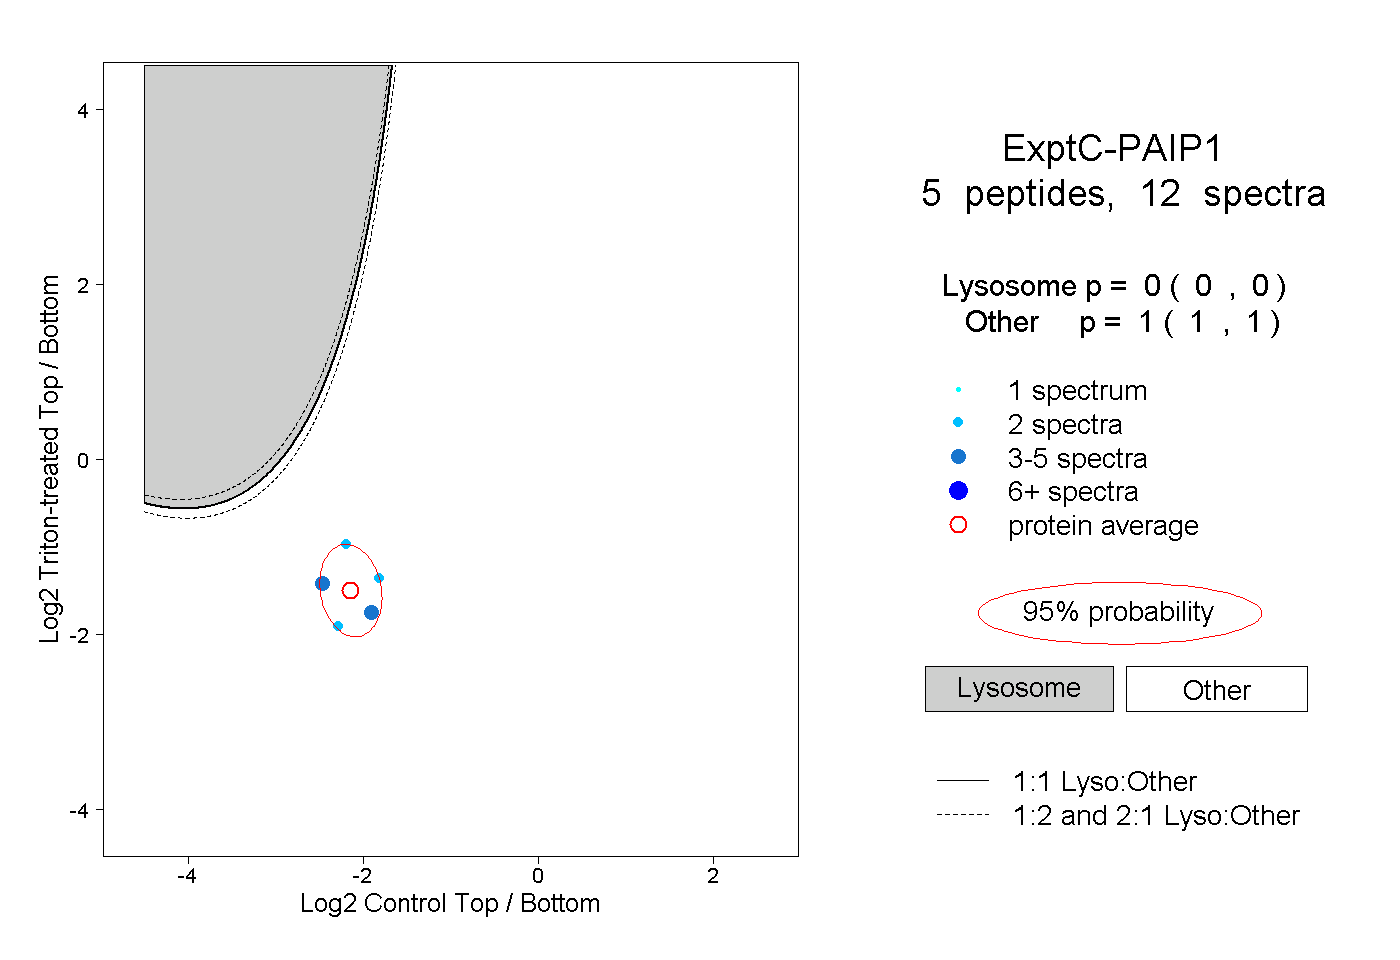
0.000 | 0.000
1.000 | 1.000