 7
7peptides
spectra
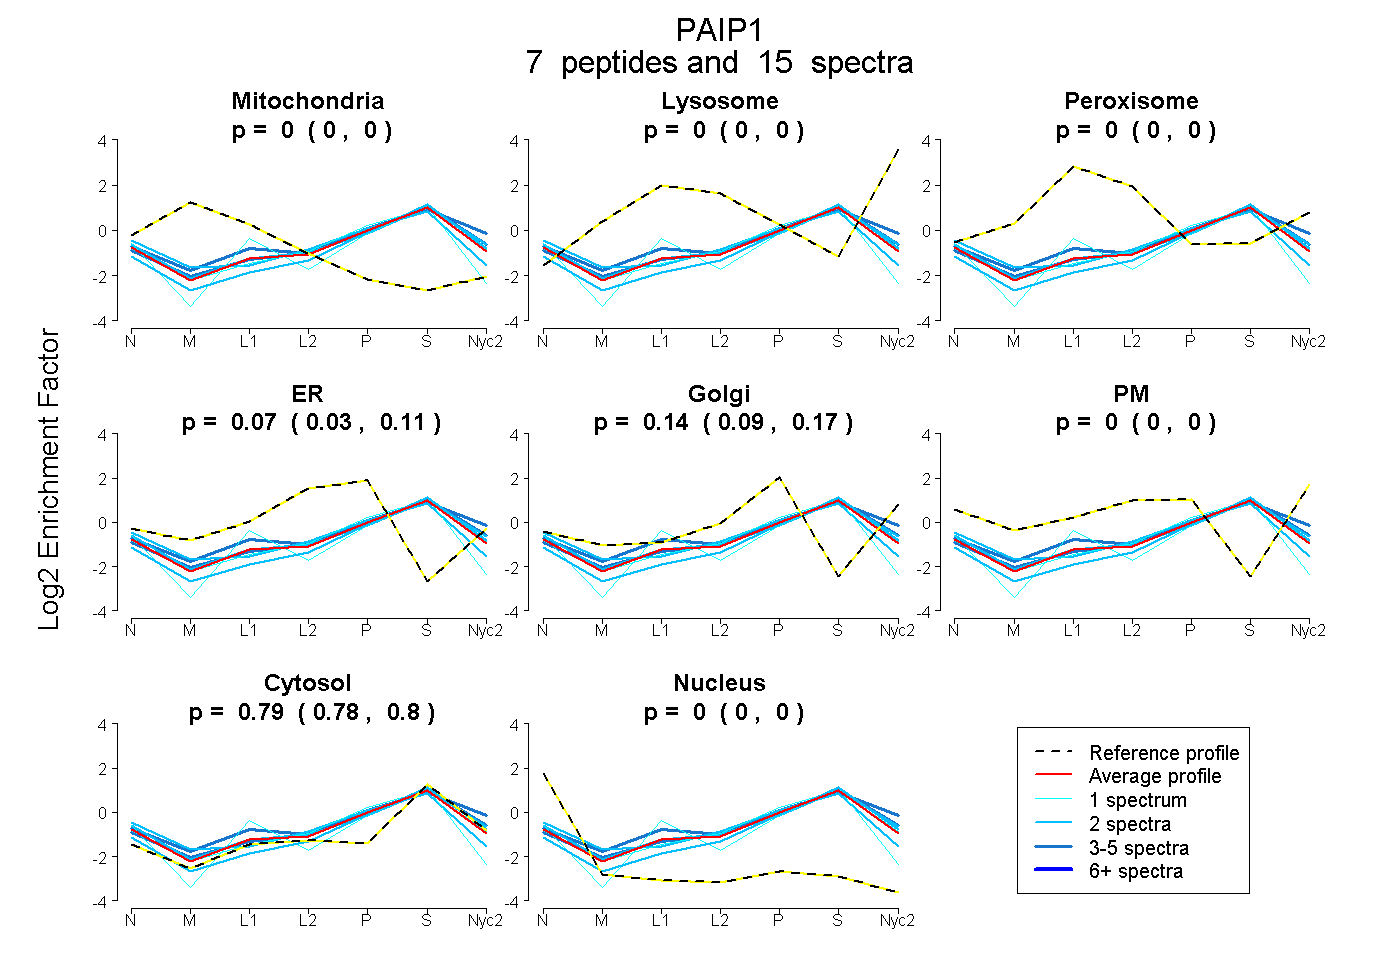
0.000 | 0.000
0.000 | 0.000
0.000 | 0.000
0.034 | 0.107
0.090 | 0.175
0.000 | 0.000
0.779 | 0.797
0.000 | 0.003
| Plot | Mito | Lyso | Perox | ER | Golgi | PM | Cytosol | Nucleus | |||||
| Expt A |
7 peptides |
15 spectra |
|
0.000 0.000 | 0.000 |
0.000 0.000 | 0.000 |
0.000 0.000 | 0.000 |
0.074 0.034 | 0.107 |
0.136 0.090 | 0.175 |
0.000 0.000 | 0.000 |
0.789 0.779 | 0.797 |
0.000 0.000 | 0.003 |
| 2 spectra, GDEVTR | 0.000 | 0.000 | 0.000 | 0.037 | 0.186 | 0.000 | 0.777 | 0.000 | ||
| 3 spectra, ADILQVGLR | 0.000 | 0.000 | 0.000 | 0.012 | 0.207 | 0.000 | 0.781 | 0.000 | ||
| 2 spectra, IENVVLDANCSR | 0.000 | 0.000 | 0.000 | 0.229 | 0.000 | 0.000 | 0.708 | 0.063 | ||
| 1 spectrum, VHATSTYR | 0.000 | 0.000 | 0.000 | 0.076 | 0.000 | 0.000 | 0.810 | 0.114 | ||
| 4 spectra, FCLESER | 0.000 | 0.012 | 0.072 | 0.000 | 0.242 | 0.000 | 0.674 | 0.000 | ||
| 1 spectrum, QLLLQR | 0.000 | 0.000 | 0.000 | 0.037 | 0.205 | 0.000 | 0.758 | 0.000 | ||
| 2 spectra, YQELLER | 0.000 | 0.000 | 0.000 | 0.000 | 0.145 | 0.000 | 0.855 | 0.000 |
| Plot | Mito | Lyso or Perox | ER | Golgi | PM | Cytosol | Nucleus | ||||||
| Expt B |
3 peptides |
4 spectra |
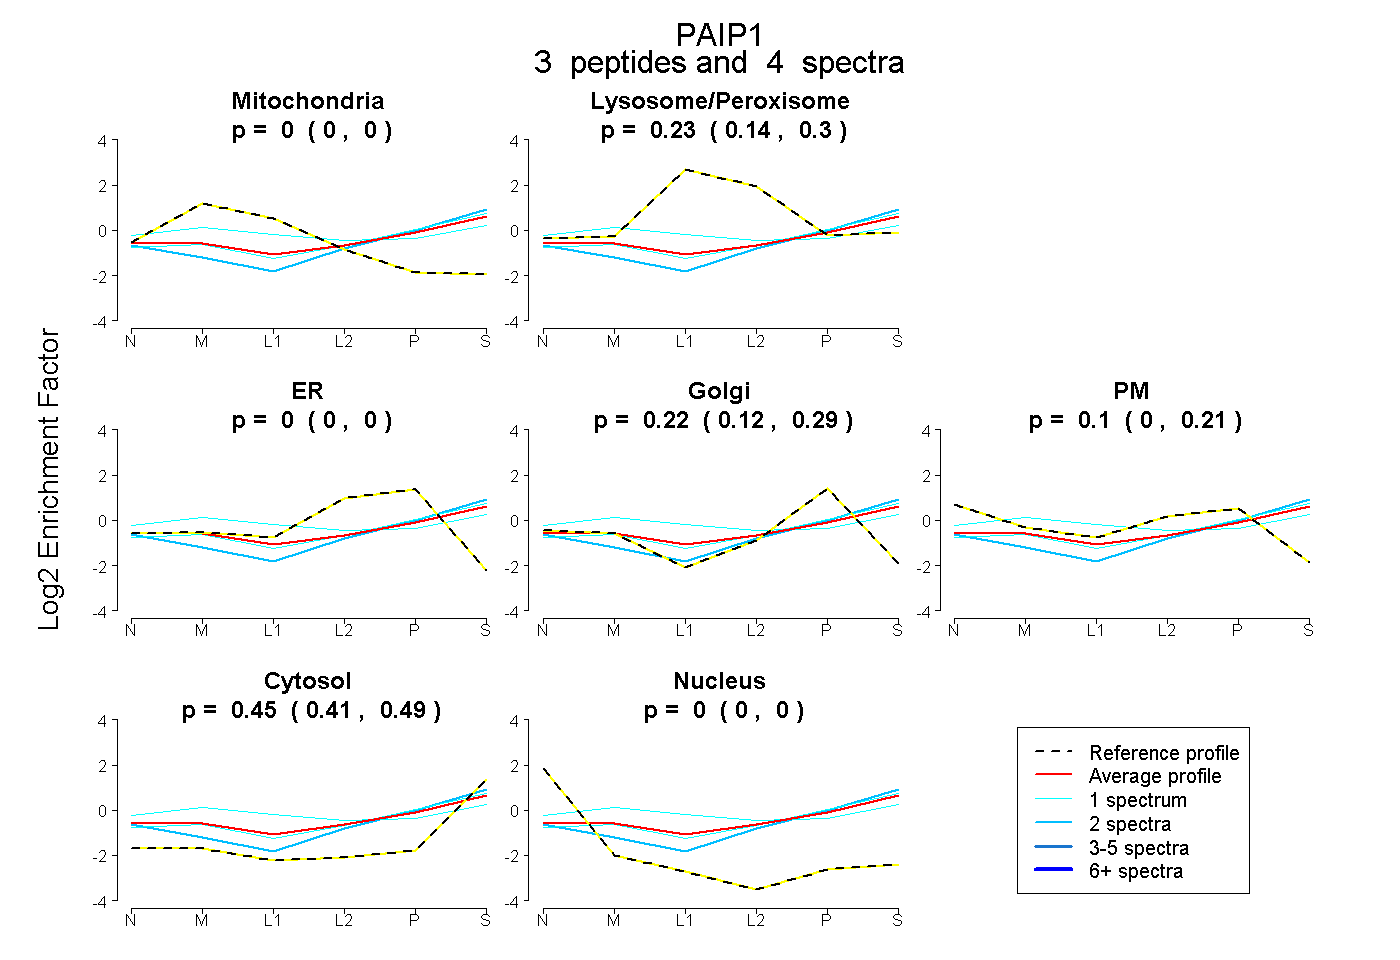 |
0.000 0.000 | 0.000 |
0.228 0.140 | 0.298 |
0.000 0.000 | 0.000 |
0.218 0.124 | 0.285 |
0.099 0.000 | 0.209 |
0.454 0.412 | 0.490 |
0.000 0.000 | 0.000 |
|||
| Plot | Lyso | Other | |||||||||||
| Expt C |
5 peptides |
12 spectra |
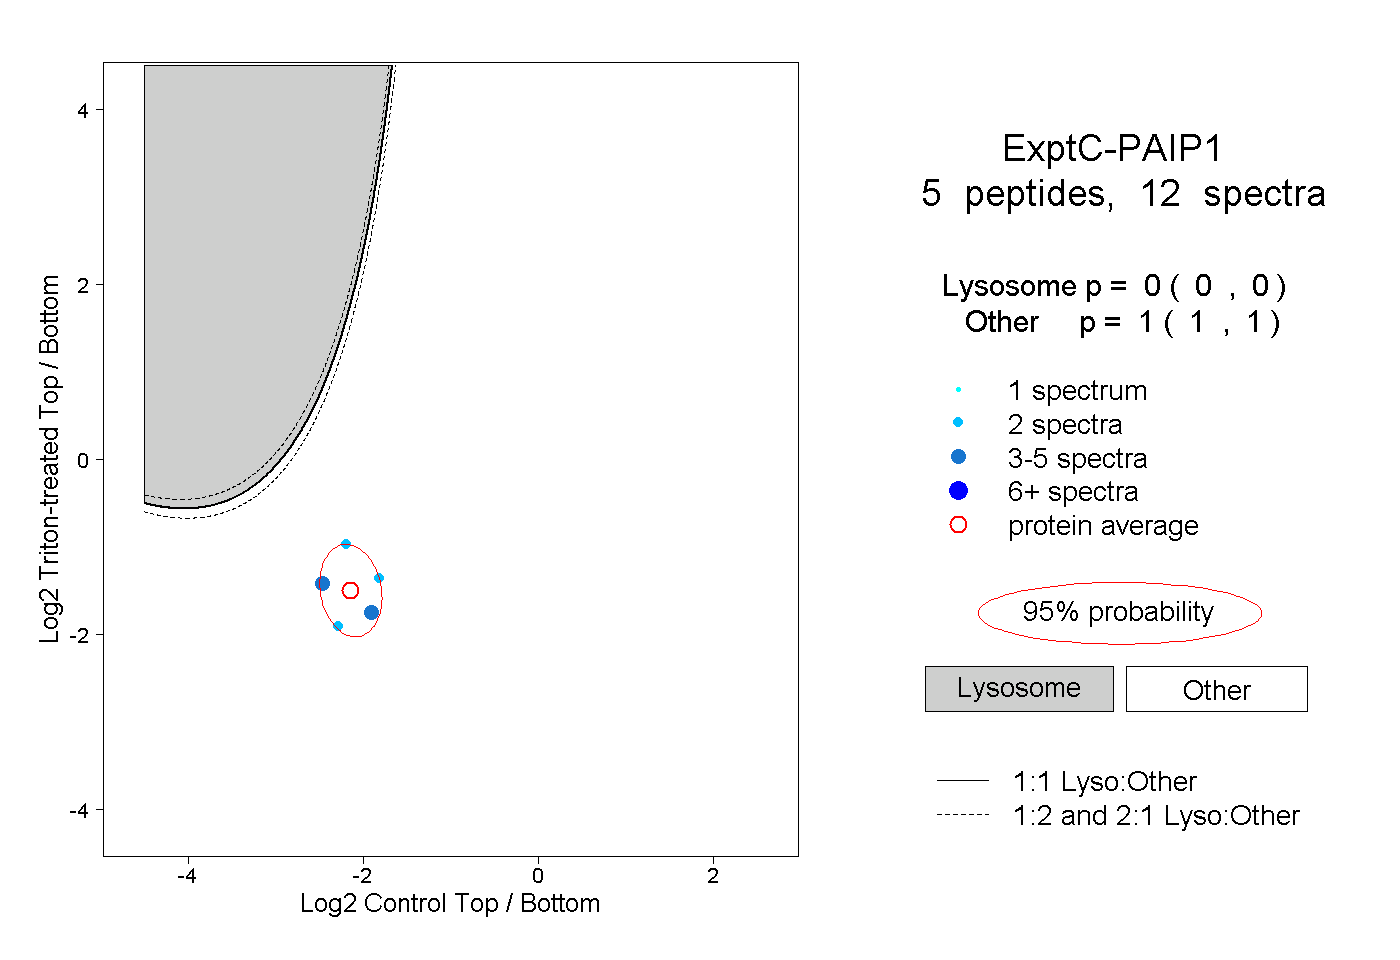 |
0.000 0.000 | 0.000 |
1.000 1.000 | 1.000 |