27
27peptides
spectra
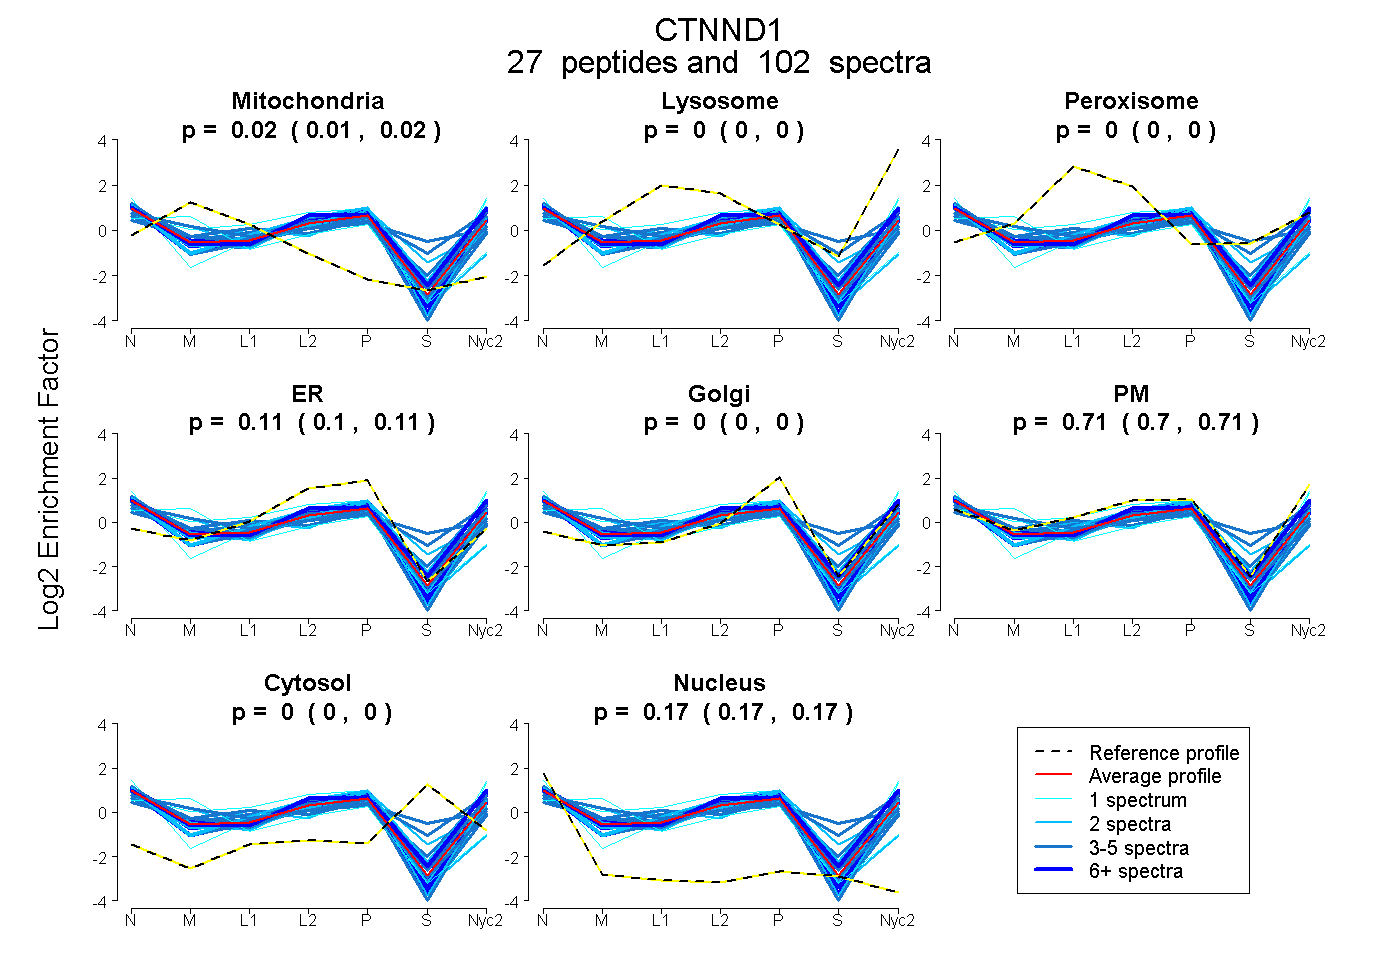
0.014 | 0.019
0.000 | 0.000
0.000 | 0.000
0.103 | 0.114
0.000 | 0.000
0.699 | 0.711
0.000 | 0.000
0.167 | 0.170
12peptides
spectra
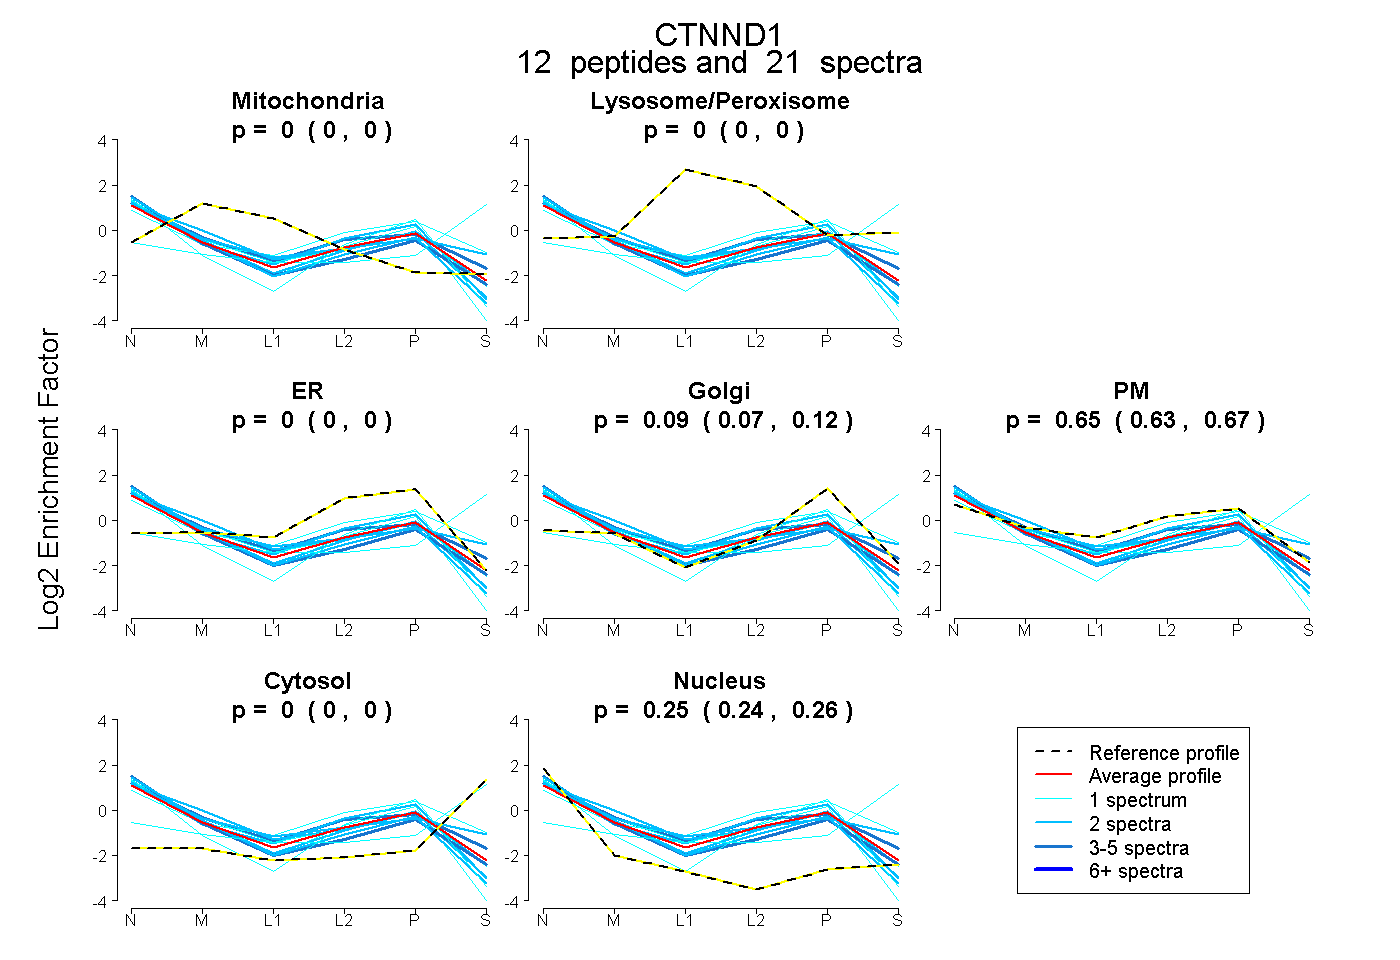
0.000 | 0.000
0.000 | 0.000
0.000 | 0.000
0.066 | 0.115
0.629 | 0.674
0.000 | 0.000
0.242 | 0.260
31peptides
spectra
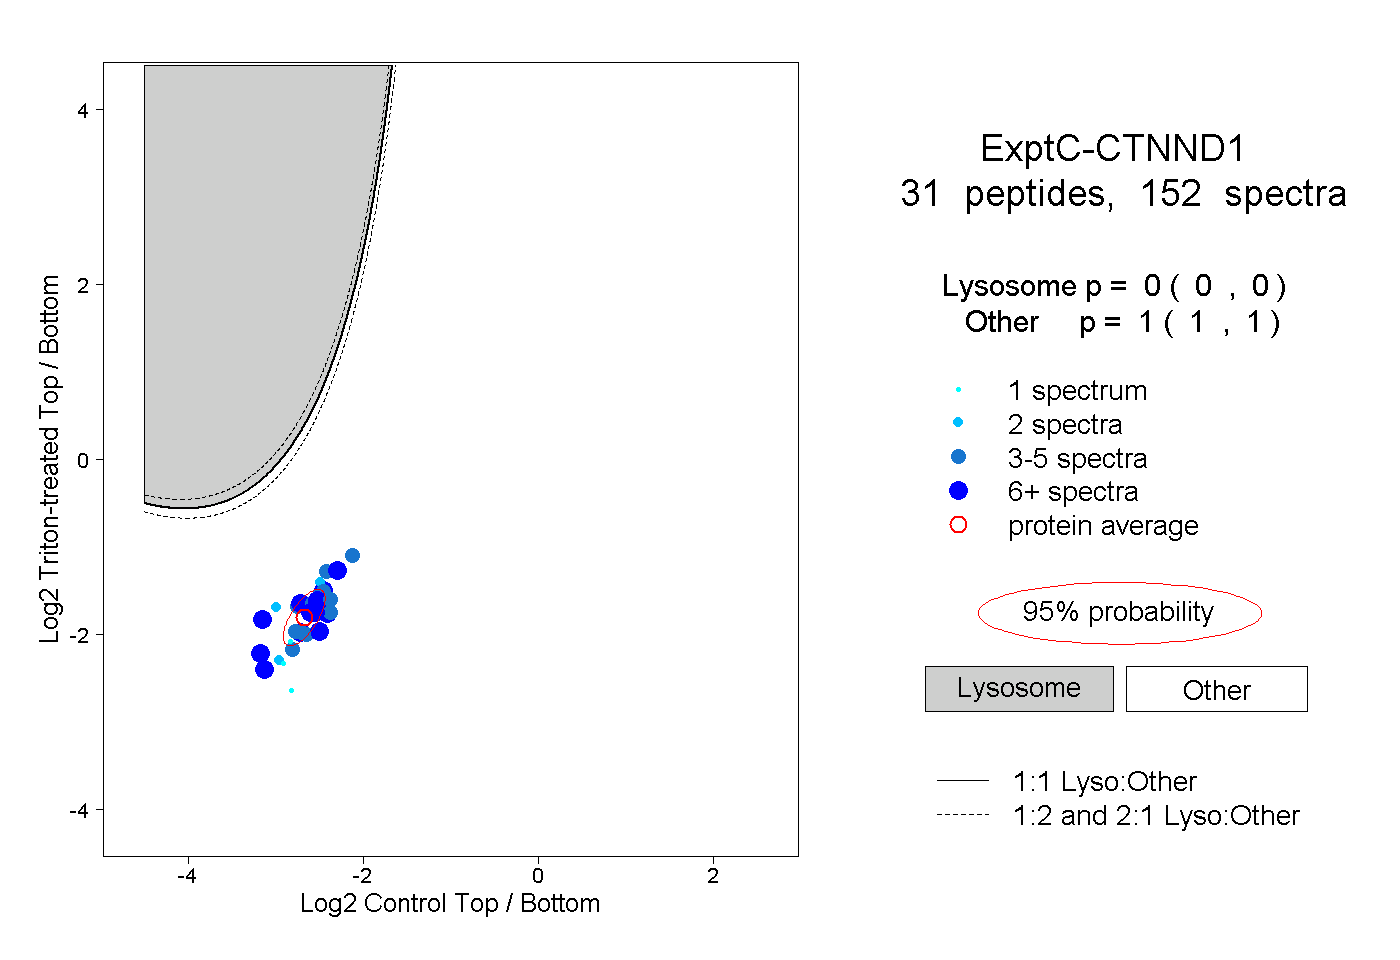
0.000 | 0.000
1.000 | 1.000