 27
27peptides
spectra
0.014 | 0.019
0.000 | 0.000
0.000 | 0.000
0.103 | 0.114
0.000 | 0.000
0.699 | 0.711
0.000 | 0.000
0.167 | 0.170
| Plot | Mito | Lyso | Perox | ER | Golgi | PM | Cytosol | Nucleus | |||||
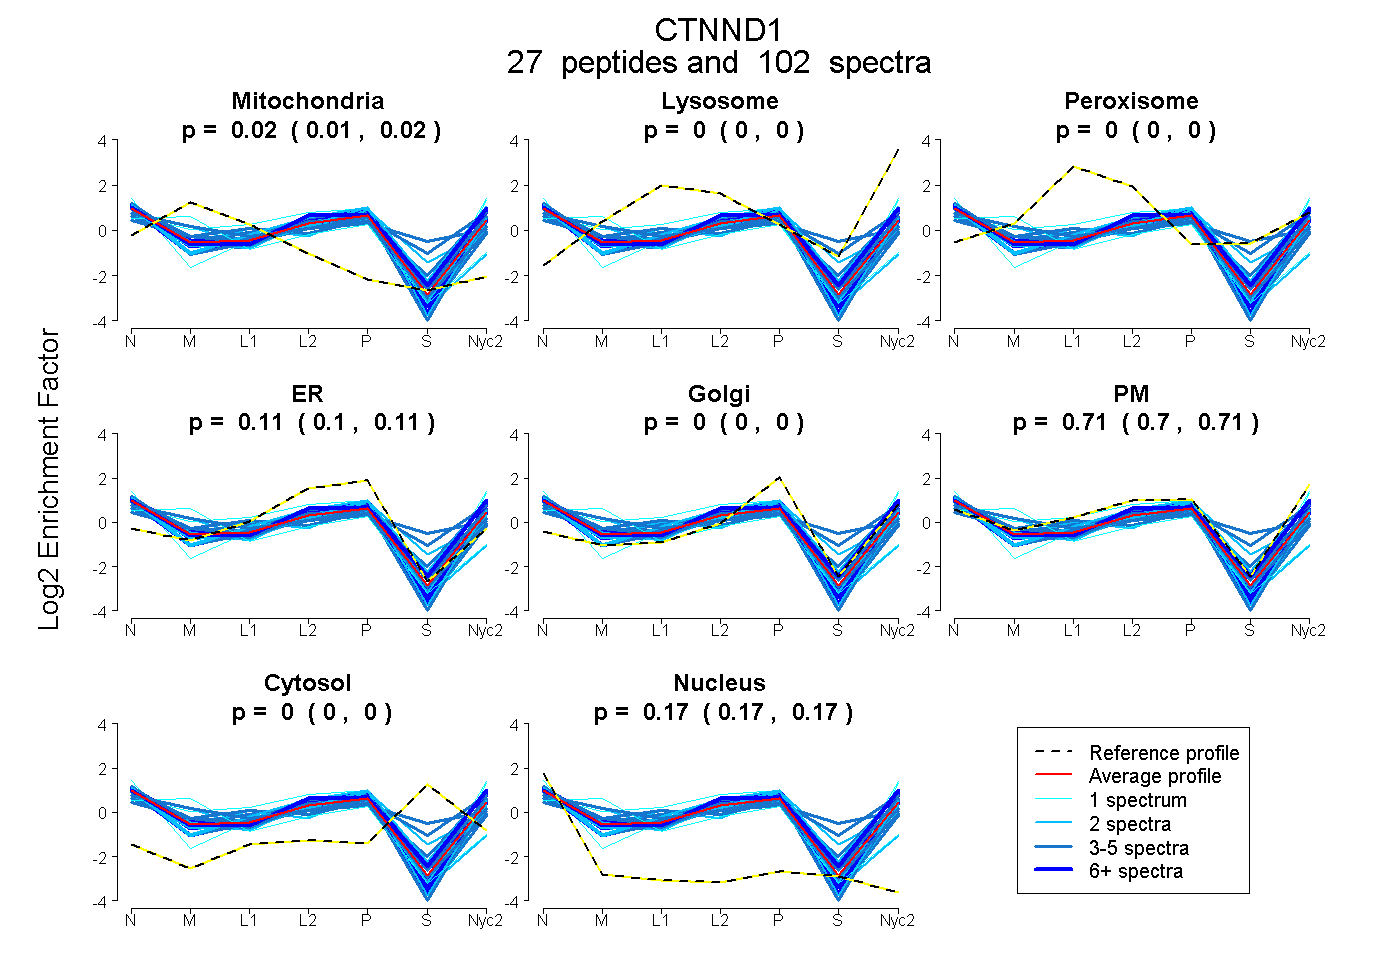
| Expt A |
27 peptides |
102 spectra |
|
0.017 0.014 | 0.019 |
0.000 0.000 | 0.000 |
0.000 0.000 | 0.000 |
0.109 0.103 | 0.114 |
0.000 0.000 | 0.000 |
0.706 0.699 | 0.711 |
0.000 0.000 | 0.000 |
0.168 0.167 | 0.170 |
| 4 spectra, EPNEDCKPR | 0.000 | 0.000 | 0.000 | 0.324 | 0.000 | 0.468 | 0.000 | 0.208 | ||
| 4 spectra, FVGDADLER | 0.096 | 0.000 | 0.000 | 0.063 | 0.000 | 0.713 | 0.000 | 0.127 | ||
| 2 spectra, EIPQAER | 0.000 | 0.000 | 0.000 | 0.208 | 0.000 | 0.605 | 0.000 | 0.187 | ||
| 1 spectrum, IYISLLK | 0.000 | 0.000 | 0.000 | 0.000 | 0.000 | 0.865 | 0.000 | 0.135 | ||
| 2 spectra, SGDLGDMEPLK | 0.000 | 0.000 | 0.000 | 0.035 | 0.056 | 0.799 | 0.012 | 0.098 | ||
| 4 spectra, NLAVDAR | 0.060 | 0.000 | 0.000 | 0.004 | 0.000 | 0.792 | 0.000 | 0.144 | ||
| 2 spectra, NCDGVPALVR | 0.000 | 0.000 | 0.000 | 0.062 | 0.000 | 0.758 | 0.000 | 0.181 | ||
| 3 spectra, YRPSMEGYR | 0.234 | 0.000 | 0.000 | 0.146 | 0.065 | 0.482 | 0.000 | 0.074 | ||
| 11 spectra, GMPPPPNWR | 0.000 | 0.000 | 0.000 | 0.078 | 0.000 | 0.752 | 0.000 | 0.171 | ||
| 4 spectra, NFHYPPDGYGR | 0.107 | 0.000 | 0.054 | 0.044 | 0.000 | 0.472 | 0.322 | 0.000 | ||
| 4 spectra, HYEDGYPGGSDNYGSLSR | 0.060 | 0.000 | 0.007 | 0.000 | 0.000 | 0.799 | 0.049 | 0.085 | ||
| 4 spectra, SDFQVNLNNASR | 0.000 | 0.000 | 0.000 | 0.086 | 0.000 | 0.729 | 0.000 | 0.185 | ||
| 1 spectrum, SNAAAYLQHLCYR | 0.394 | 0.000 | 0.000 | 0.240 | 0.189 | 0.093 | 0.000 | 0.083 | ||
| 2 spectra, HVSAQLER | 0.000 | 0.000 | 0.256 | 0.000 | 0.417 | 0.153 | 0.002 | 0.172 | ||
| 2 spectra, SLDNNYSTLNER | 0.000 | 0.000 | 0.000 | 0.167 | 0.000 | 0.668 | 0.000 | 0.165 | ||
| 8 spectra, LVLINK | 0.000 | 0.000 | 0.000 | 0.027 | 0.000 | 0.815 | 0.000 | 0.158 | ||
| 1 spectrum, GSLASLDSLR | 0.086 | 0.000 | 0.000 | 0.048 | 0.000 | 0.866 | 0.000 | 0.000 | ||
| 4 spectra, ALSAIADLLTSEHER | 0.000 | 0.000 | 0.000 | 0.120 | 0.000 | 0.696 | 0.000 | 0.184 | ||
| 7 spectra, TGTPSDPR | 0.000 | 0.000 | 0.000 | 0.001 | 0.000 | 0.865 | 0.000 | 0.134 | ||
| 9 spectra, FHPEPYGLEDDQR | 0.000 | 0.000 | 0.000 | 0.150 | 0.074 | 0.617 | 0.000 | 0.159 | ||
| 2 spectra, GYELLFQPEVVR | 0.000 | 0.000 | 0.000 | 0.126 | 0.000 | 0.670 | 0.000 | 0.204 | ||
| 3 spectra, NLSYQVHR | 0.087 | 0.000 | 0.041 | 0.000 | 0.000 | 0.653 | 0.220 | 0.000 | ||
| 2 spectra, QPELPEVIAMLGFR | 0.000 | 0.000 | 0.000 | 0.043 | 0.000 | 0.753 | 0.000 | 0.204 | ||
| 1 spectrum, EQEAQFEK | 0.000 | 0.000 | 0.000 | 0.024 | 0.000 | 0.806 | 0.000 | 0.170 | ||
| 2 spectra, EVHLGACGALK | 0.233 | 0.000 | 0.000 | 0.507 | 0.000 | 0.123 | 0.000 | 0.137 | ||
| 5 spectra, QDVYGPQPQVR | 0.000 | 0.000 | 0.000 | 0.148 | 0.013 | 0.617 | 0.000 | 0.222 | ||
| 8 spectra, GIPILVGLLDHPK | 0.015 | 0.000 | 0.000 | 0.090 | 0.000 | 0.716 | 0.000 | 0.179 |
| Plot | Mito | Lyso or Perox | ER | Golgi | PM | Cytosol | Nucleus | ||||||
| Expt B |
12 peptides |
21 spectra |
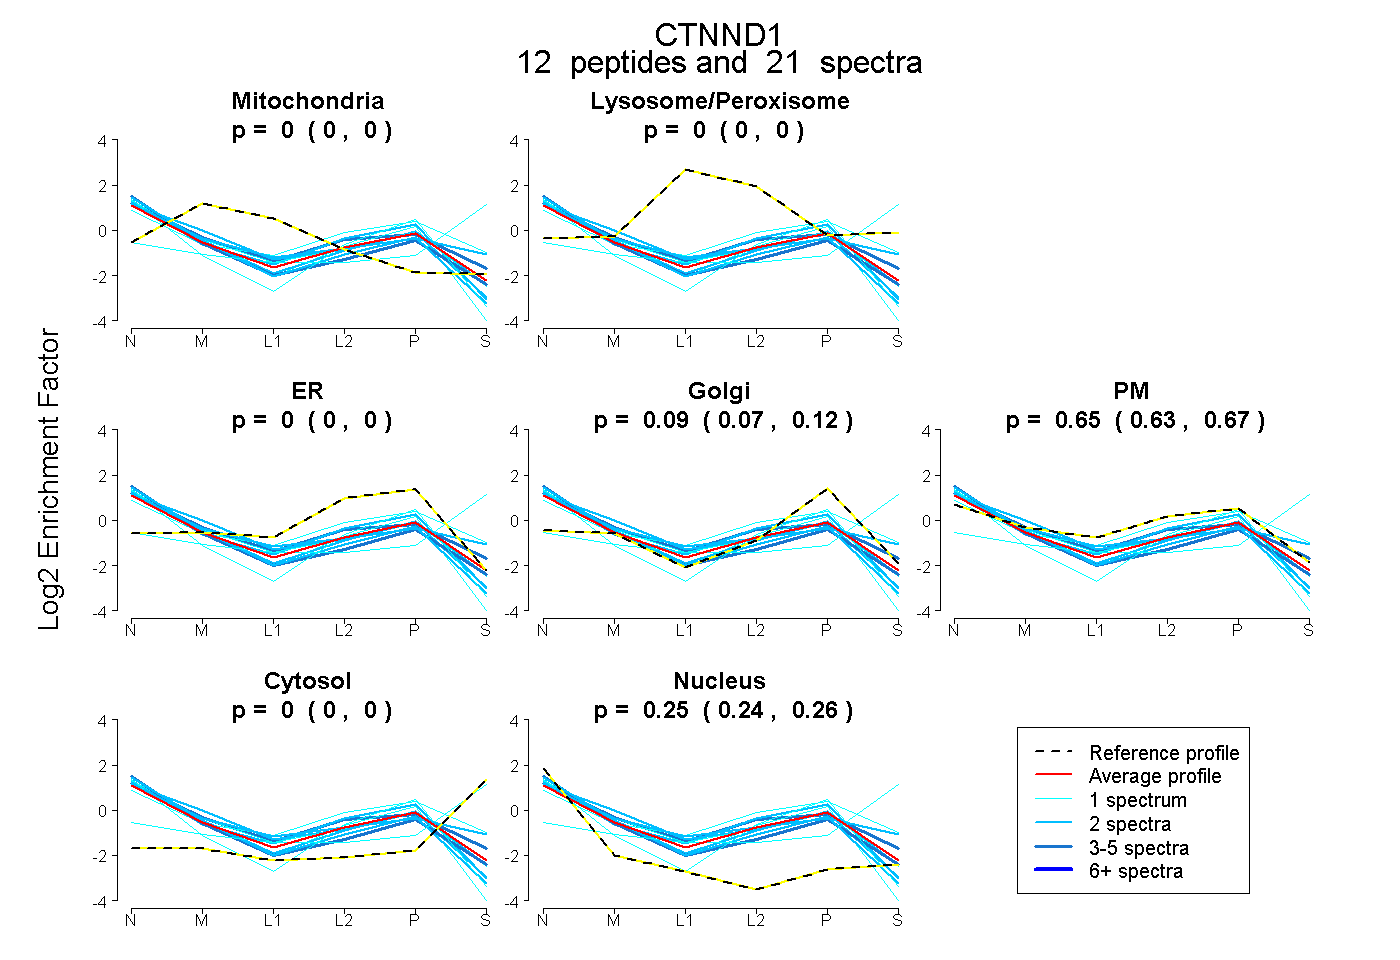 |
0.000 0.000 | 0.000 |
0.000 0.000 | 0.000 |
0.000 0.000 | 0.000 |
0.095 0.066 | 0.115 |
0.653 0.629 | 0.674 |
0.000 0.000 | 0.000 |
0.252 0.242 | 0.260 |
|||
| Plot | Lyso | Other | |||||||||||
| Expt C |
31 peptides |
152 spectra |
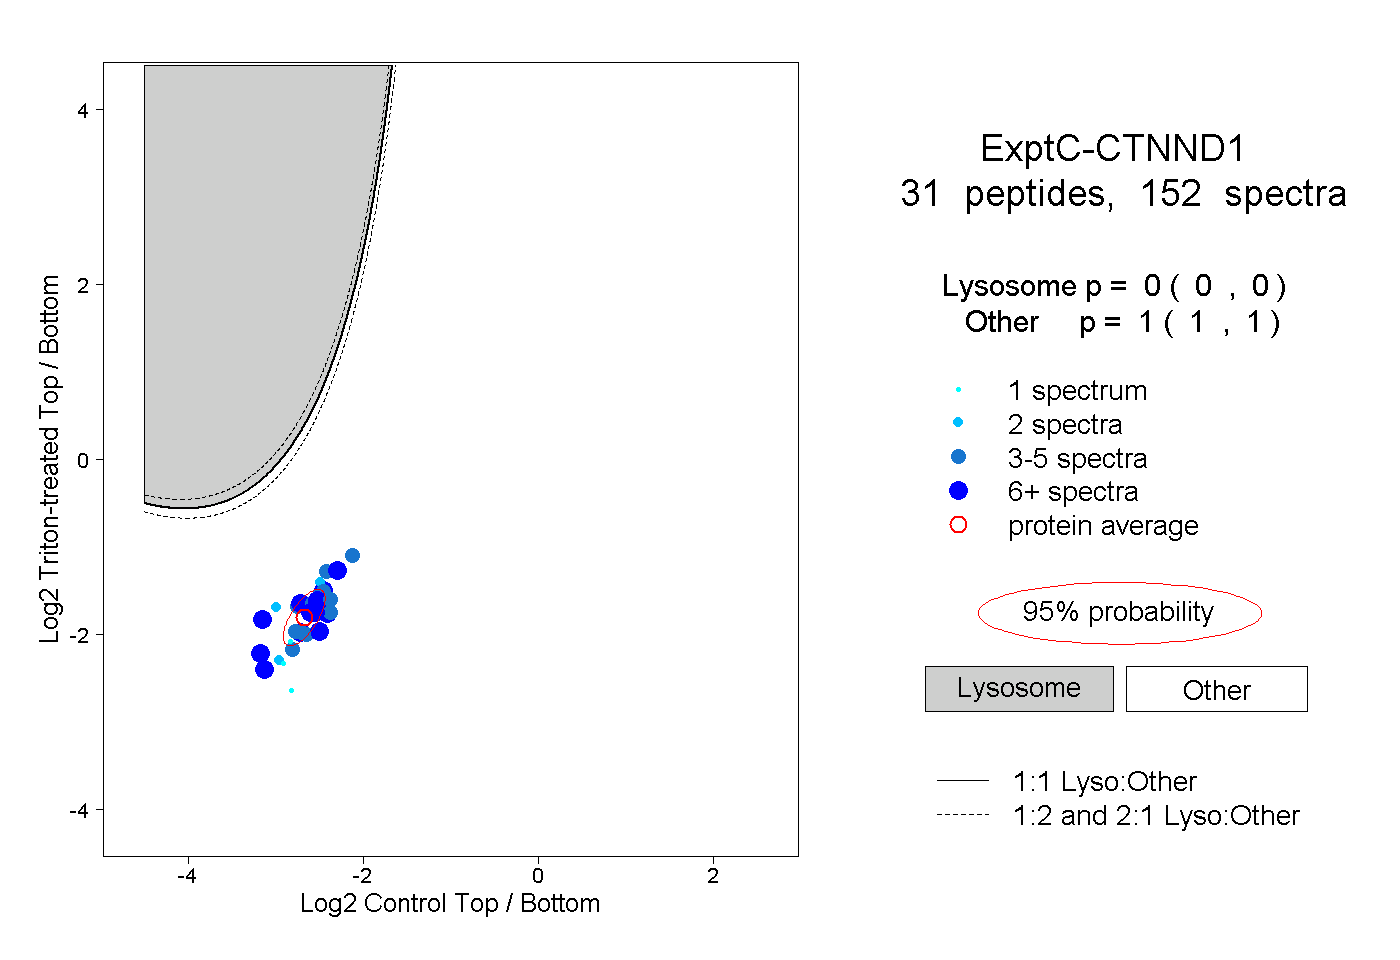 |
0.000 0.000 | 0.000 |
1.000 1.000 | 1.000 |
||||||||
| Plot | Lyso | Other | |||||||||||
| Expt D |
7 peptides |
11 spectra |
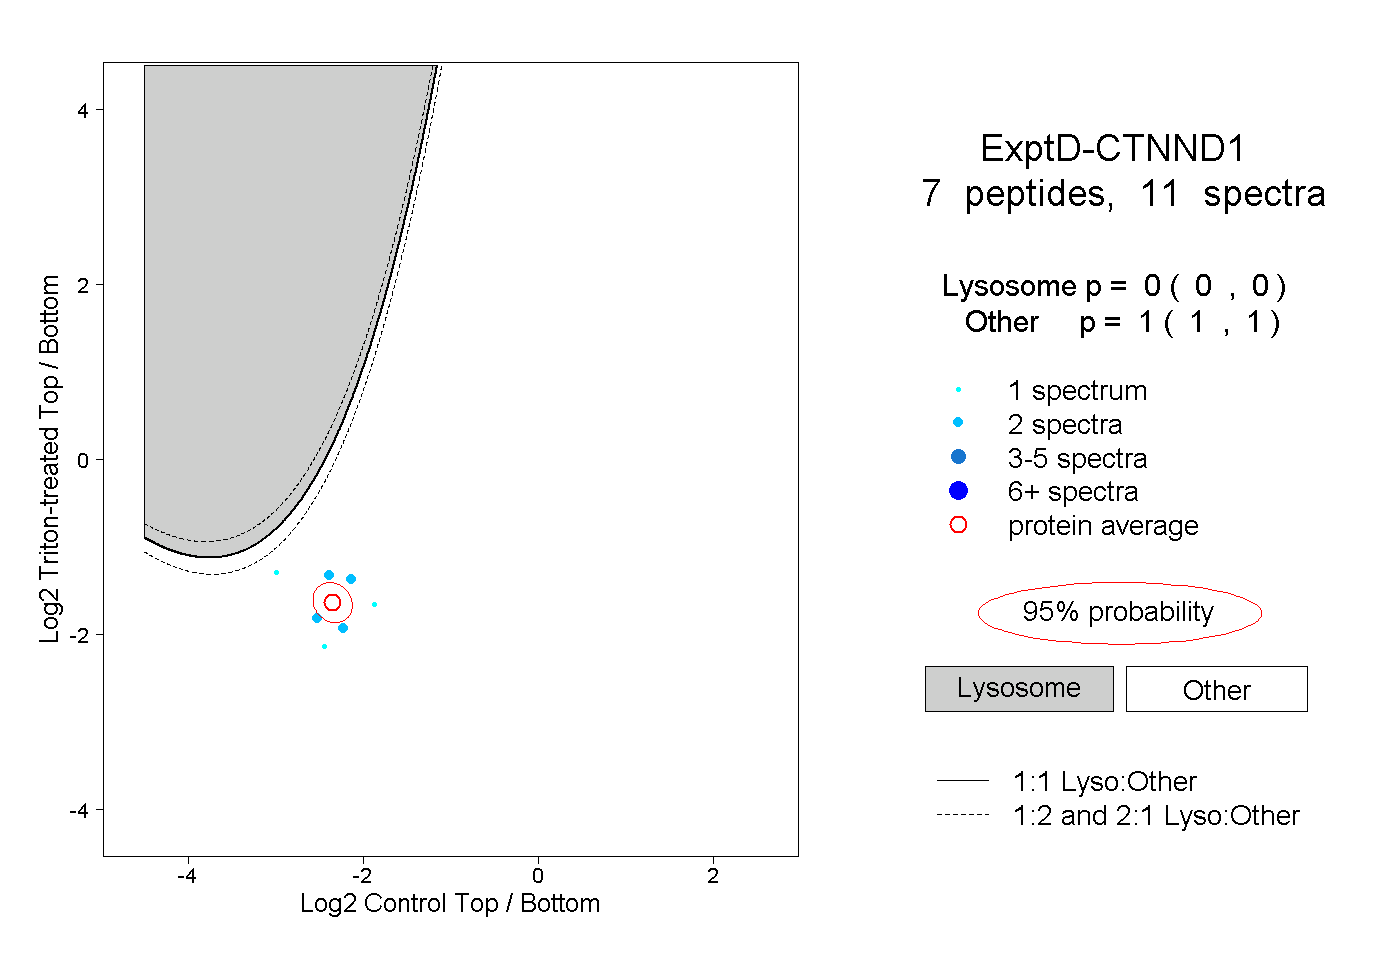 |
0.000 0.000 | 0.000 |
1.000 1.000 | 1.000 |