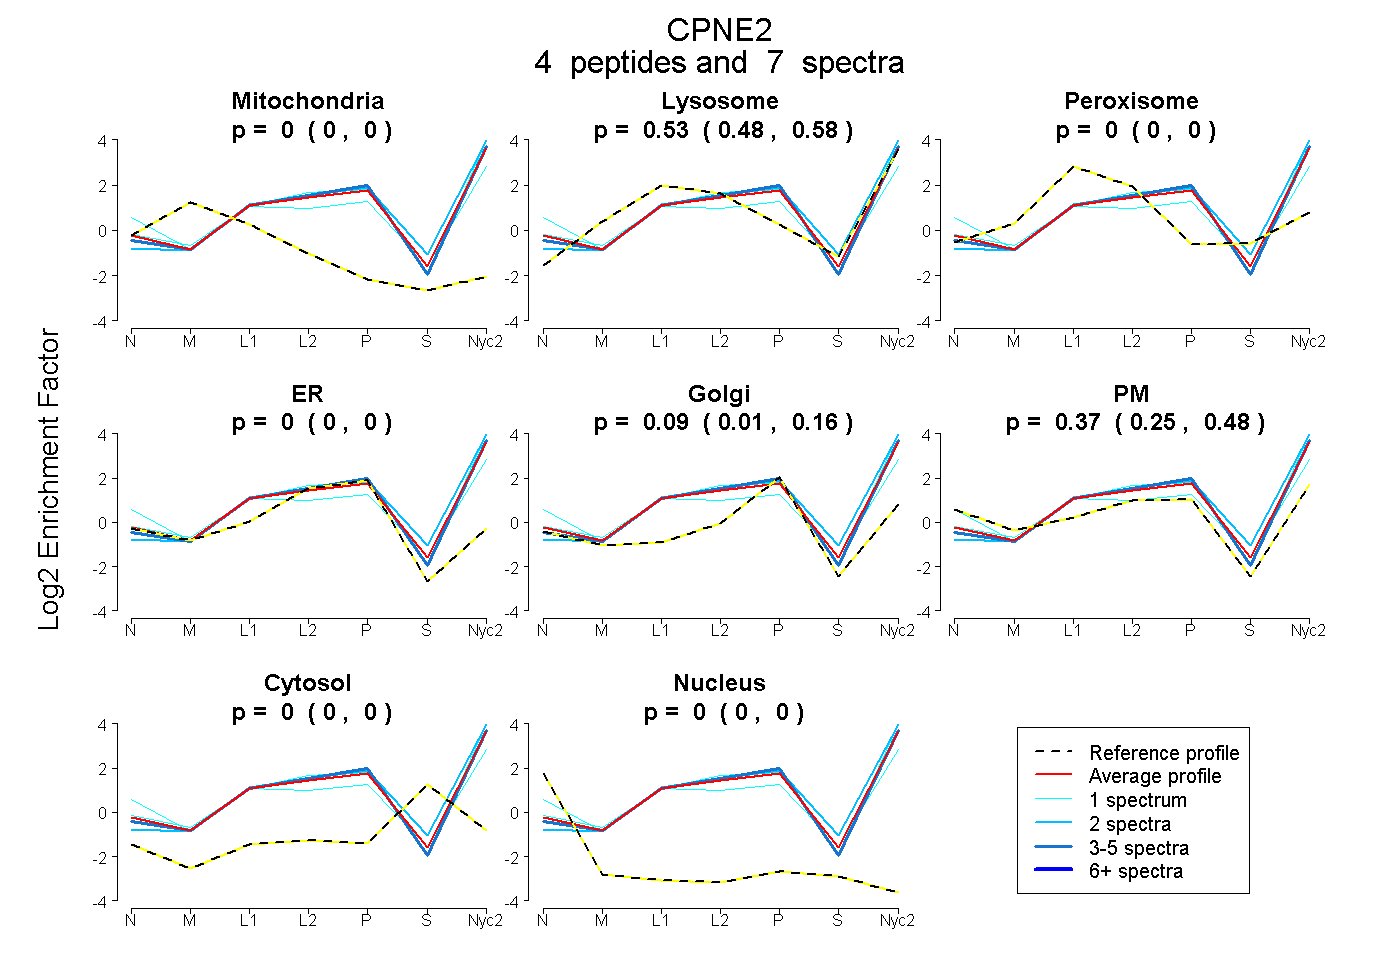
 4
4peptides
spectra
0.000 | 0.000
0.479 | 0.581
0.000 | 0.000
0.000 | 0.000
0.013 | 0.155
0.249 | 0.481
0.000 | 0.000
0.000 | 0.000
| Plot | Mito | Lyso | Perox | ER | Golgi | PM | Cytosol | Nucleus | |||||
| Expt A |
4 peptides |
7 spectra |
|
0.000 0.000 | 0.000 |
0.535 0.479 | 0.581 |
0.000 0.000 | 0.000 |
0.000 0.000 | 0.000 |
0.090 0.013 | 0.155 |
0.375 0.249 | 0.481 |
0.000 0.000 | 0.000 |
0.000 0.000 | 0.000 |
| 1 spectrum, FALFDQDK | 0.000 | 0.535 | 0.000 | 0.000 | 0.000 | 0.465 | 0.000 | 0.000 | ||
| 2 spectra, WMEFDR | 0.000 | 0.740 | 0.000 | 0.000 | 0.260 | 0.000 | 0.000 | 0.000 | ||
| 3 spectra, WMLVHR | 0.000 | 0.546 | 0.000 | 0.000 | 0.142 | 0.312 | 0.000 | 0.000 | ||
| 1 spectrum, AVLAELPQQVVQYFK | 0.000 | 0.295 | 0.000 | 0.000 | 0.000 | 0.705 | 0.000 | 0.000 |
| Plot | Lyso | Other | |||||||||||
| Expt C |
3 peptides |
4 spectra |
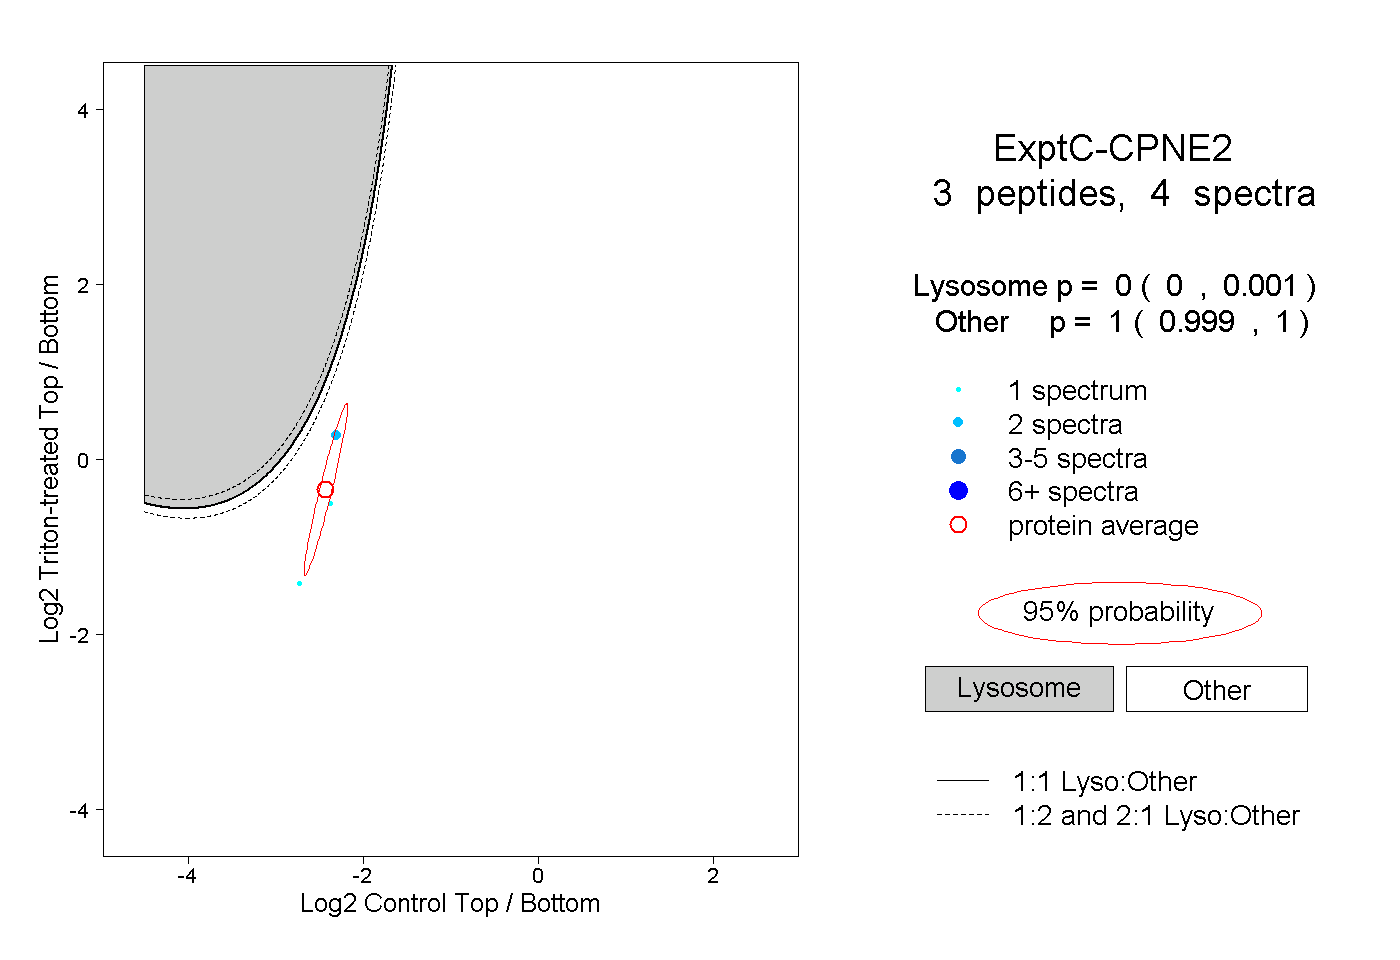 |
0.000 0.000 | 0.001 |
1.000 0.999 | 1.000 |