ANXA3
[ENSRNOP00000063496]
Main page
| | | Plot |
Mito |
Lyso |
|
Perox |
ER |
Golgi |
PM |
Cytosol |
Nucleus |
|
| Expt A |
 17
17
peptides |
69
spectra |
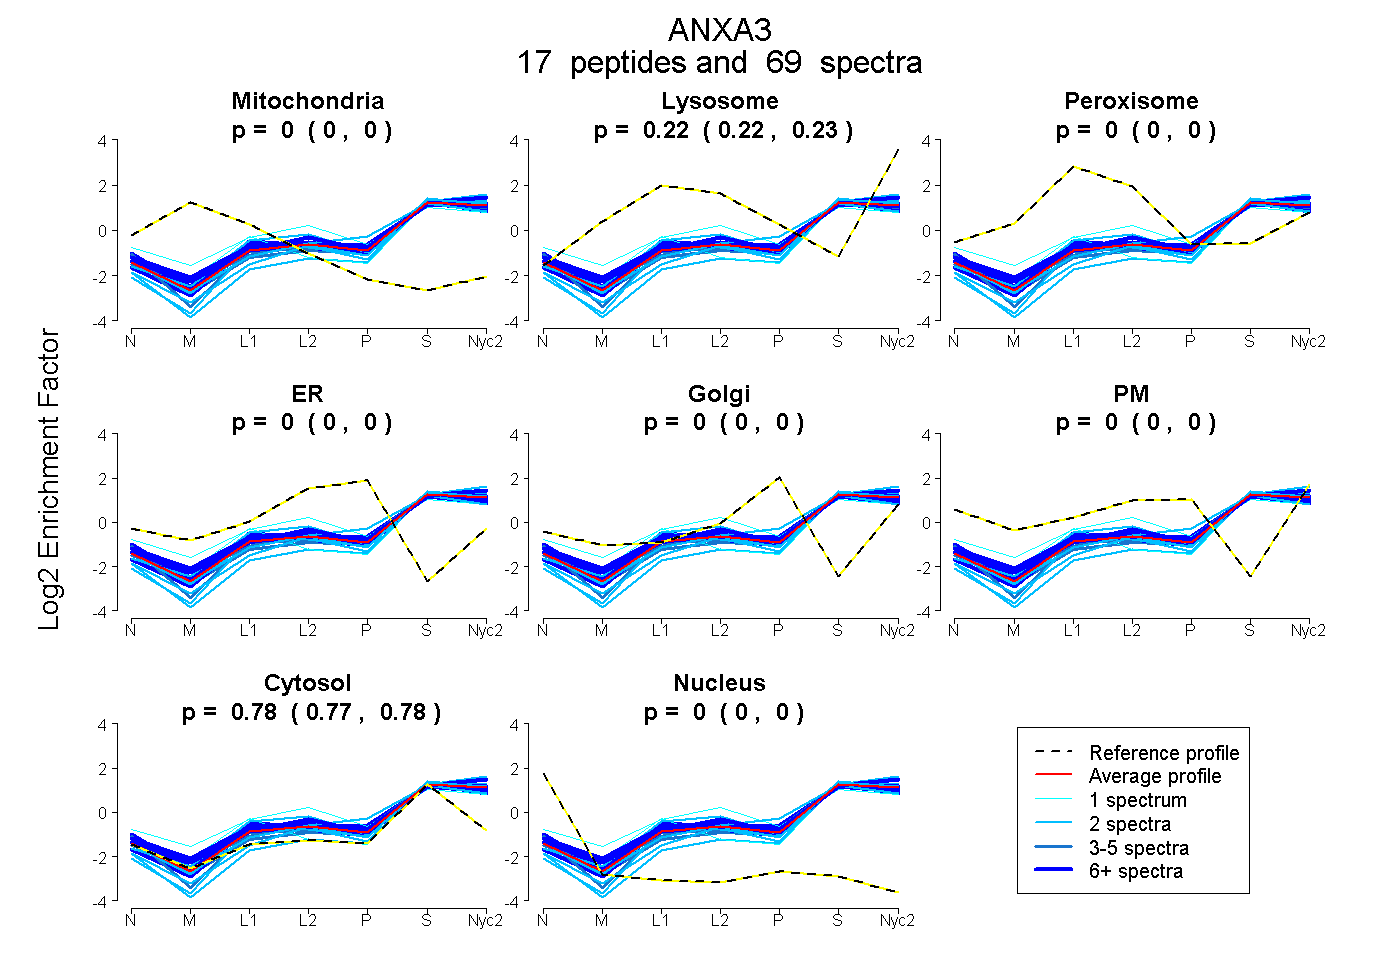 |
0.000
0.000 | 0.000 |
0.224
0.222 | 0.226 |
|
0.000
0.000 | 0.000 |
0.000
0.000 | 0.000 |
0.000
0.000 | 0.000 |
0.000
0.000 | 0.000 |
0.776
0.774 | 0.778 |
0.000
0.000 | 0.000 |
|
| | | Plot |
Mito |
|
Lyso or Perox |
|
ER |
Golgi |
PM |
Cytosol |
Nucleus |
|
| Expt B |
5
peptides |
12
spectra |
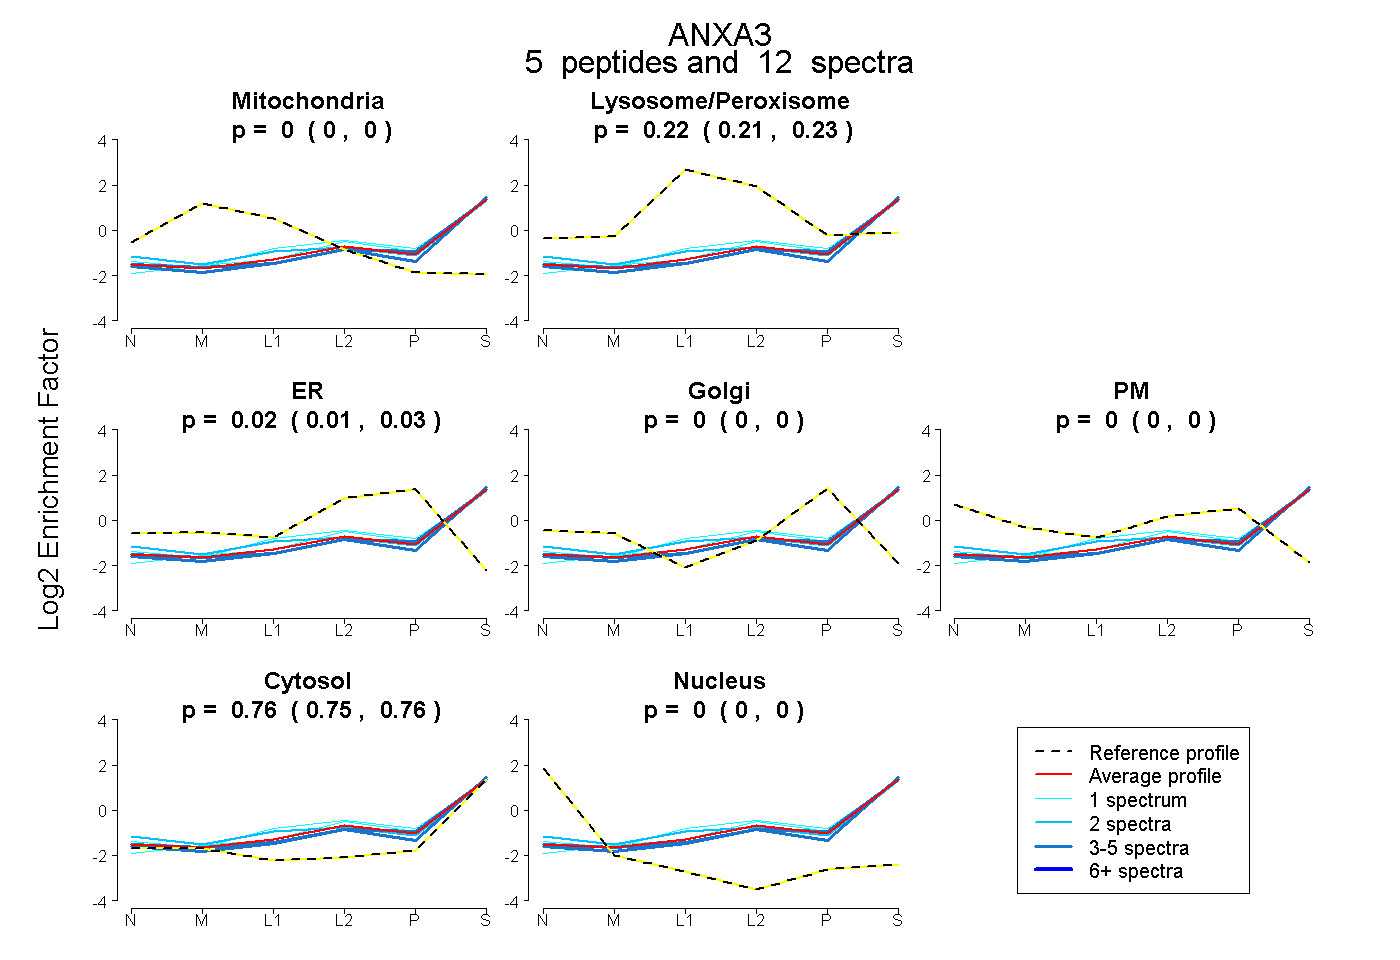 |
0.000
0.000 | 0.000 |
|
0.220
0.206 | 0.232 |
|
0.024
0.011 | 0.034 |
0.000
0.000 | 0.000 |
0.000
0.000 | 0.000 |
0.756
0.748 | 0.763 |
0.000
0.000 | 0.000 |
|
| 2 spectra, LTFDEYR |
0.000 |
|
0.279 |
|
0.000 |
0.000 |
0.000 |
0.721 |
0.000 |
|
| 4 spectra, TLINILTER |
0.000 |
|
0.176 |
|
0.056 |
0.000 |
0.000 |
0.768 |
0.000 |
|
| 1 spectrum, IHQALK |
0.000 |
|
0.227 |
|
0.035 |
0.000 |
0.000 |
0.738 |
0.000 |
|
| 4 spectra, NTPAFLAGR |
0.000 |
|
0.189 |
|
0.000 |
0.000 |
0.000 |
0.811 |
0.000 |
|
| 1 spectrum, DAQTLYDAGEK |
0.000 |
|
0.310 |
|
0.015 |
0.000 |
0.000 |
0.675 |
0.000 |
|
| | | Plot |
|
Lyso |
|
|
|
|
|
|
|
Other |
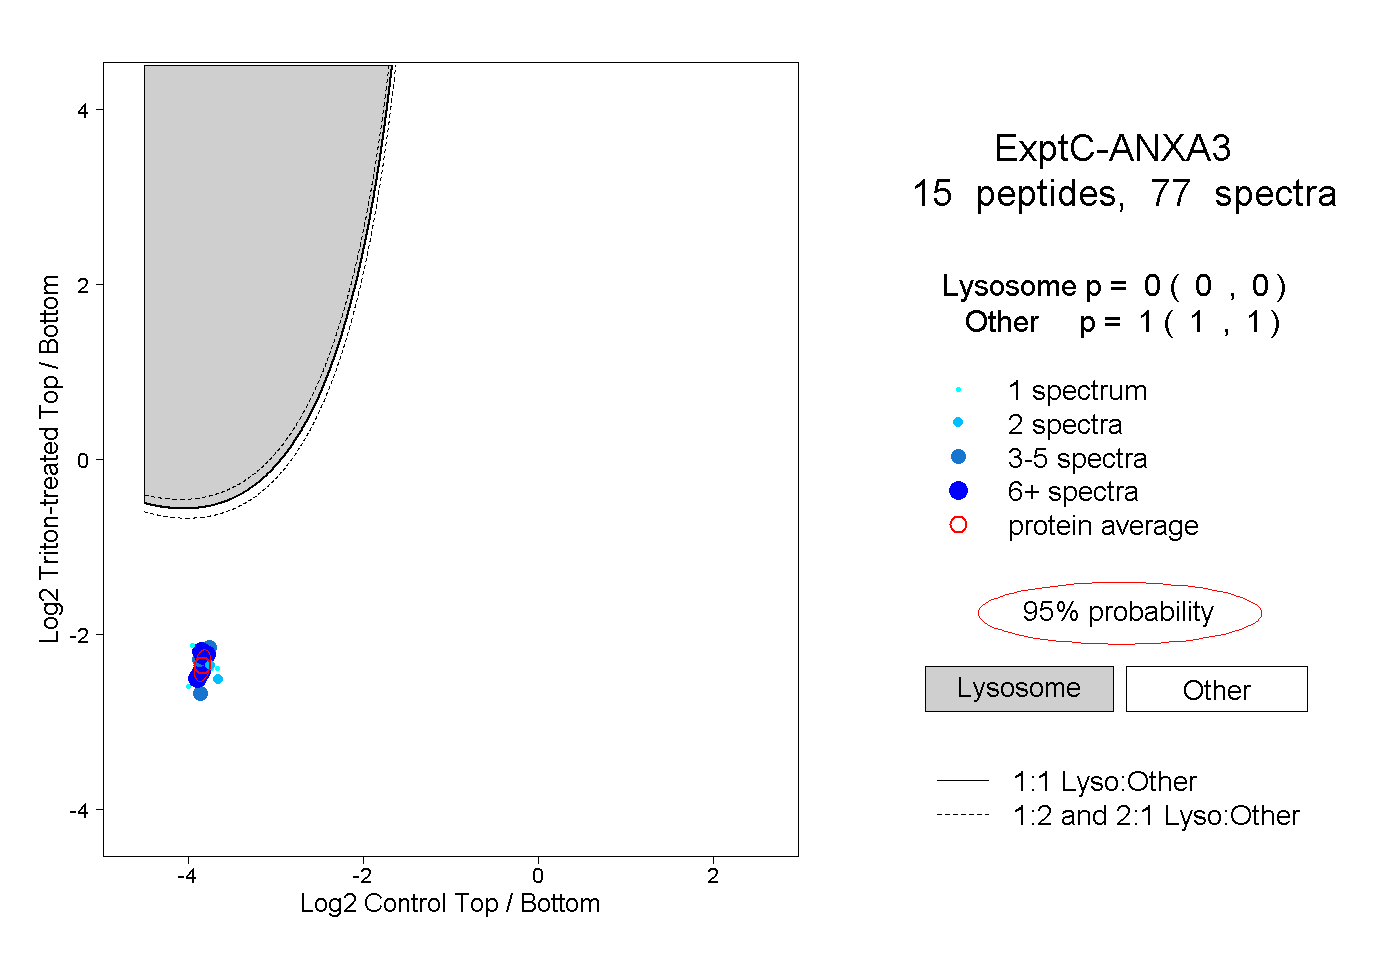
| Expt C |
15
peptides |
77
spectra |
 |
|
0.000
0.000 | 0.000 |
|
|
|
|
|
|
|
1.000
1.000 | 1.000 |
| | | Plot |
|
Lyso |
|
|
|
|
|
|
|
Other |
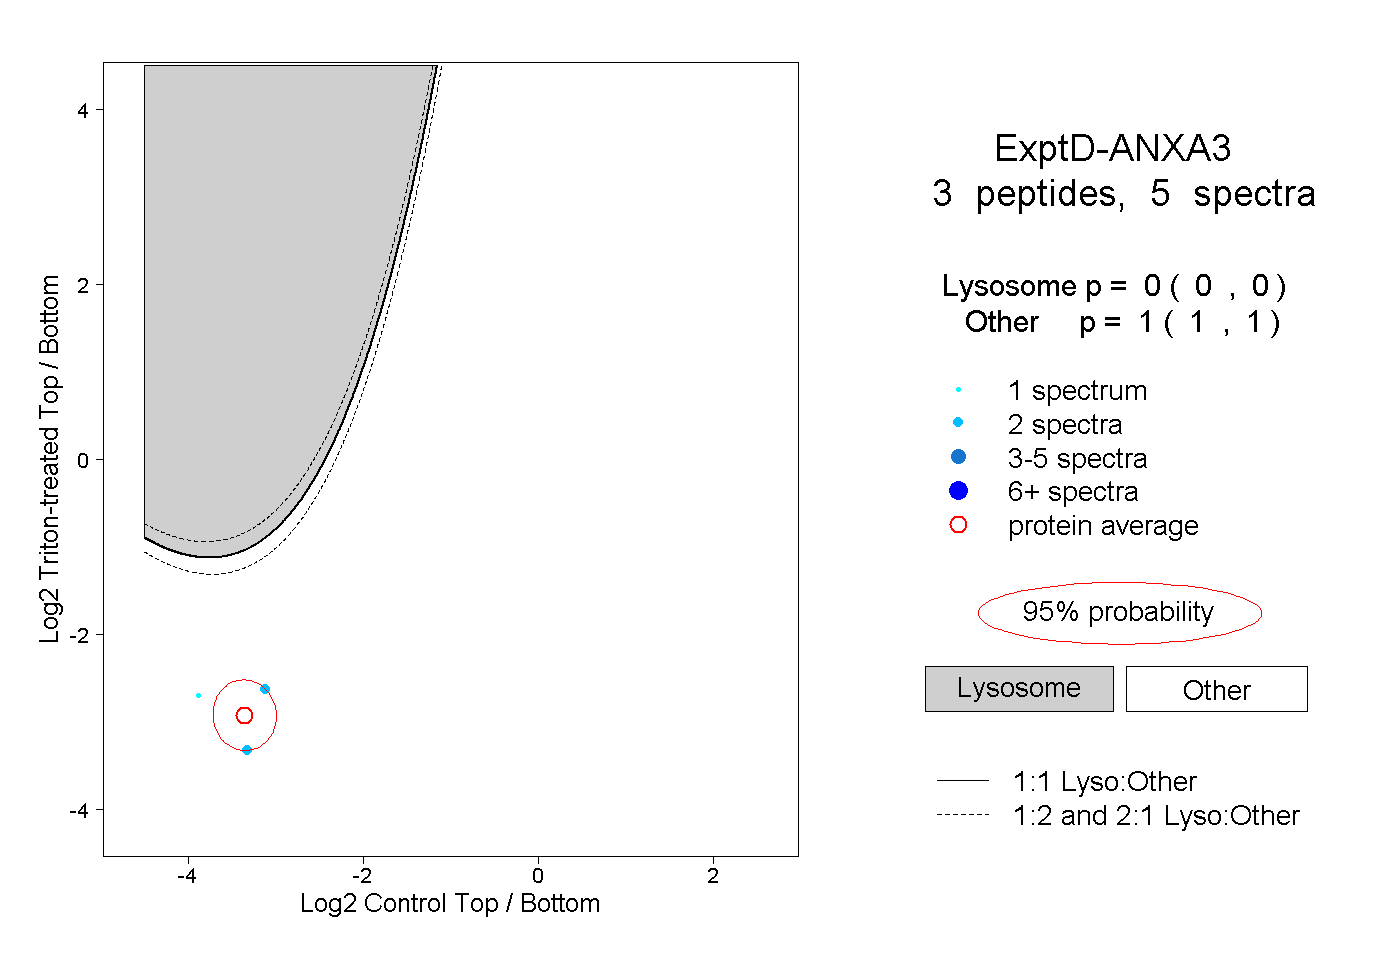
| Expt D |
3
peptides |
5
spectra |
 |
|
0.000
0.000 | 0.000 |
|
|
|
|
|
|
|
1.000
1.000 | 1.000 |