 15
15peptides
spectra
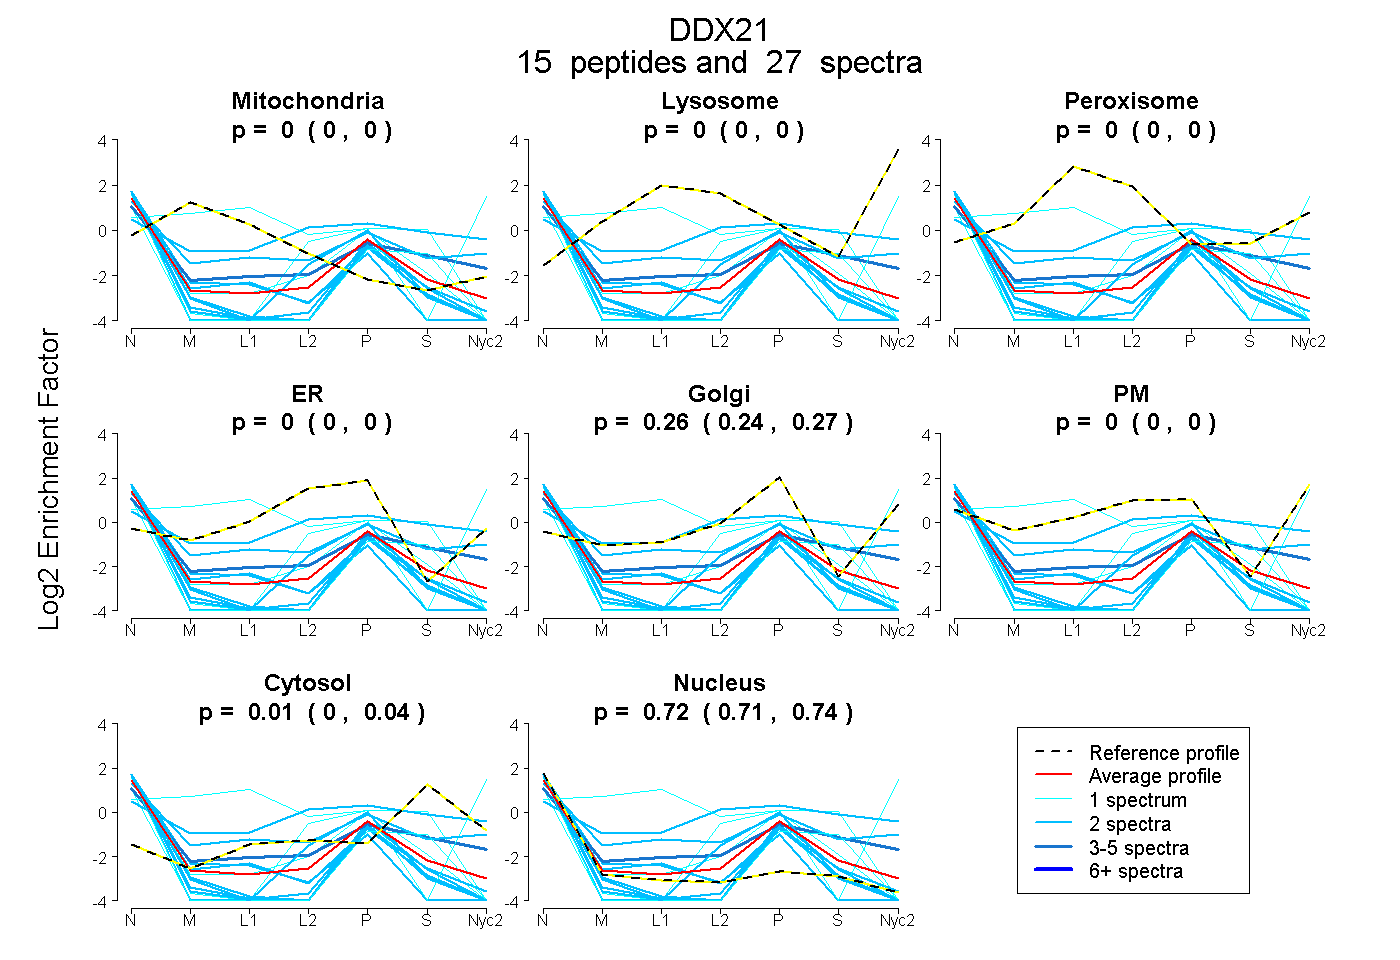
0.000 | 0.000
0.000 | 0.000
0.000 | 0.000
0.000 | 0.000
0.240 | 0.274
0.000 | 0.000
0.000 | 0.035
0.707 | 0.740
4peptides
spectra
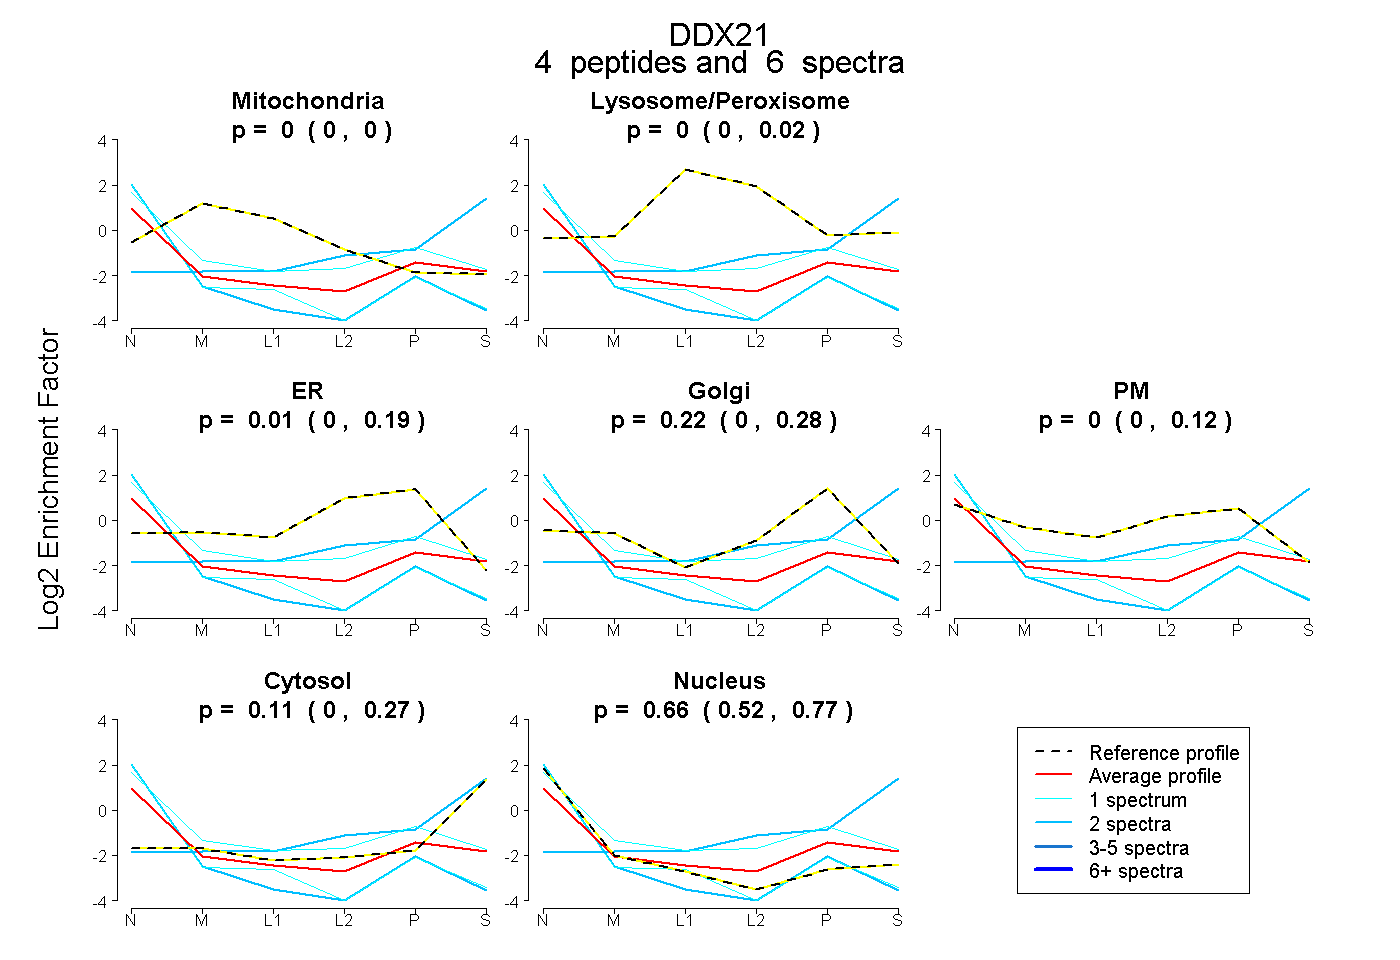
0.000 | 0.000
0.000 | 0.022
0.000 | 0.191
0.000 | 0.275
0.000 | 0.123
0.000 | 0.270
0.521 | 0.768