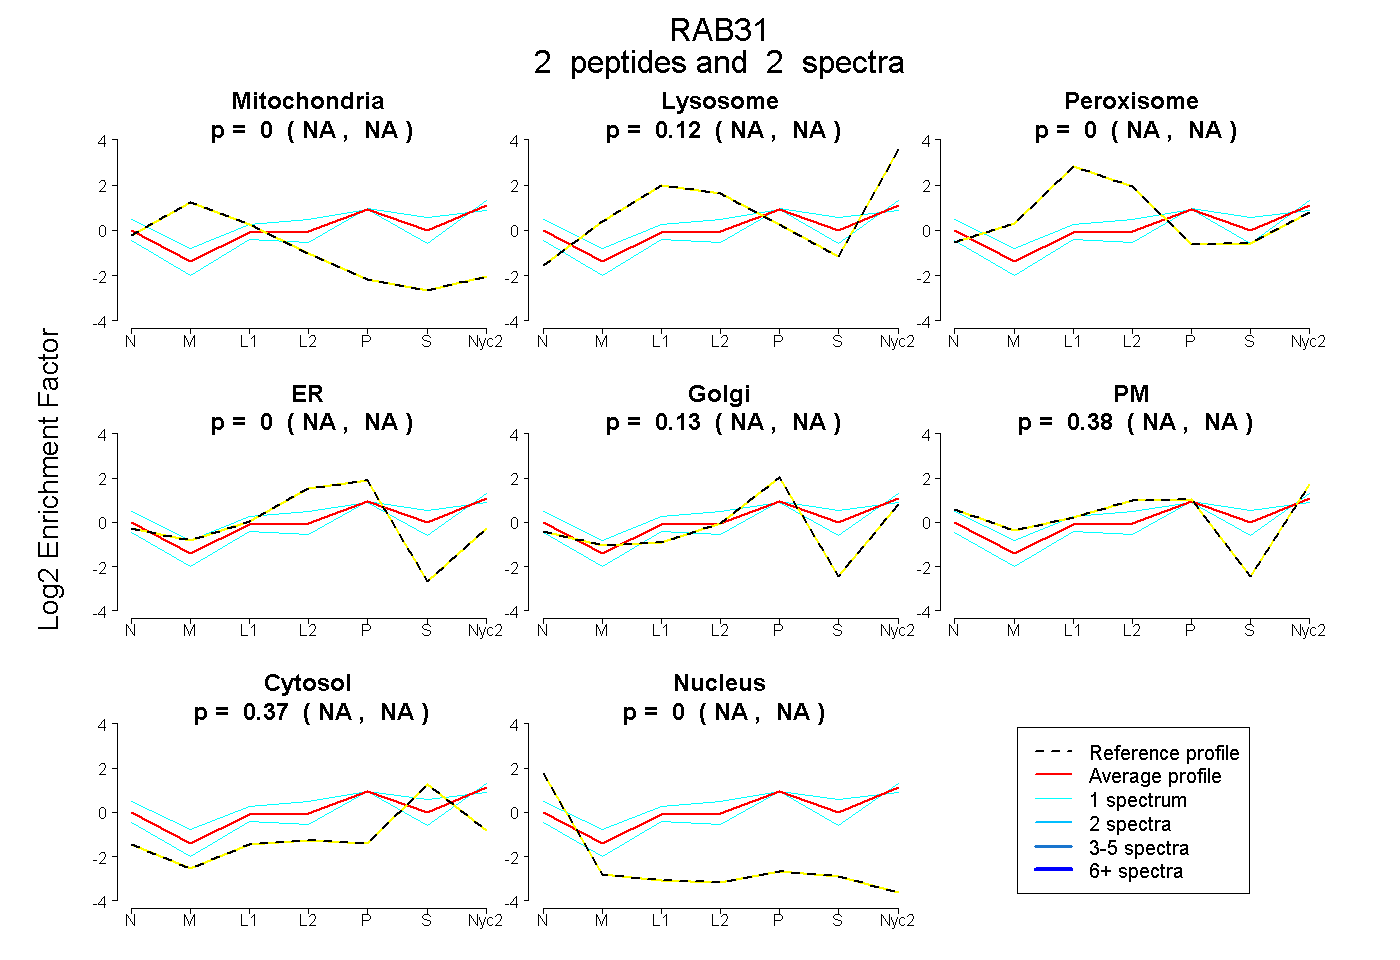
 2
2peptides
spectra
NA | NA
NA | NA
NA | NA
NA | NA
NA | NA
NA | NA
NA | NA
NA | NA
| Plot | Mito | Lyso | Perox | ER | Golgi | PM | Cytosol | Nucleus | |||||
| Expt A |
2 peptides |
2 spectra |
|
0.000 NA | NA |
0.122 NA | NA |
0.000 NA | NA |
0.000 NA | NA |
0.125 NA | NA |
0.378 NA | NA |
0.374 NA | NA |
0.000 NA | NA |
| 1 spectrum, TVPCGNELHK | 0.000 | 0.036 | 0.087 | 0.000 | 0.000 | 0.649 | 0.227 | 0.000 | ||
| 1 spectrum, LGNQSLQAGR | 0.000 | 0.166 | 0.000 | 0.000 | 0.347 | 0.000 | 0.488 | 0.000 |
| Plot | Lyso | Other | |||||||||||
| Expt C |
1 peptide |
1 spectrum |
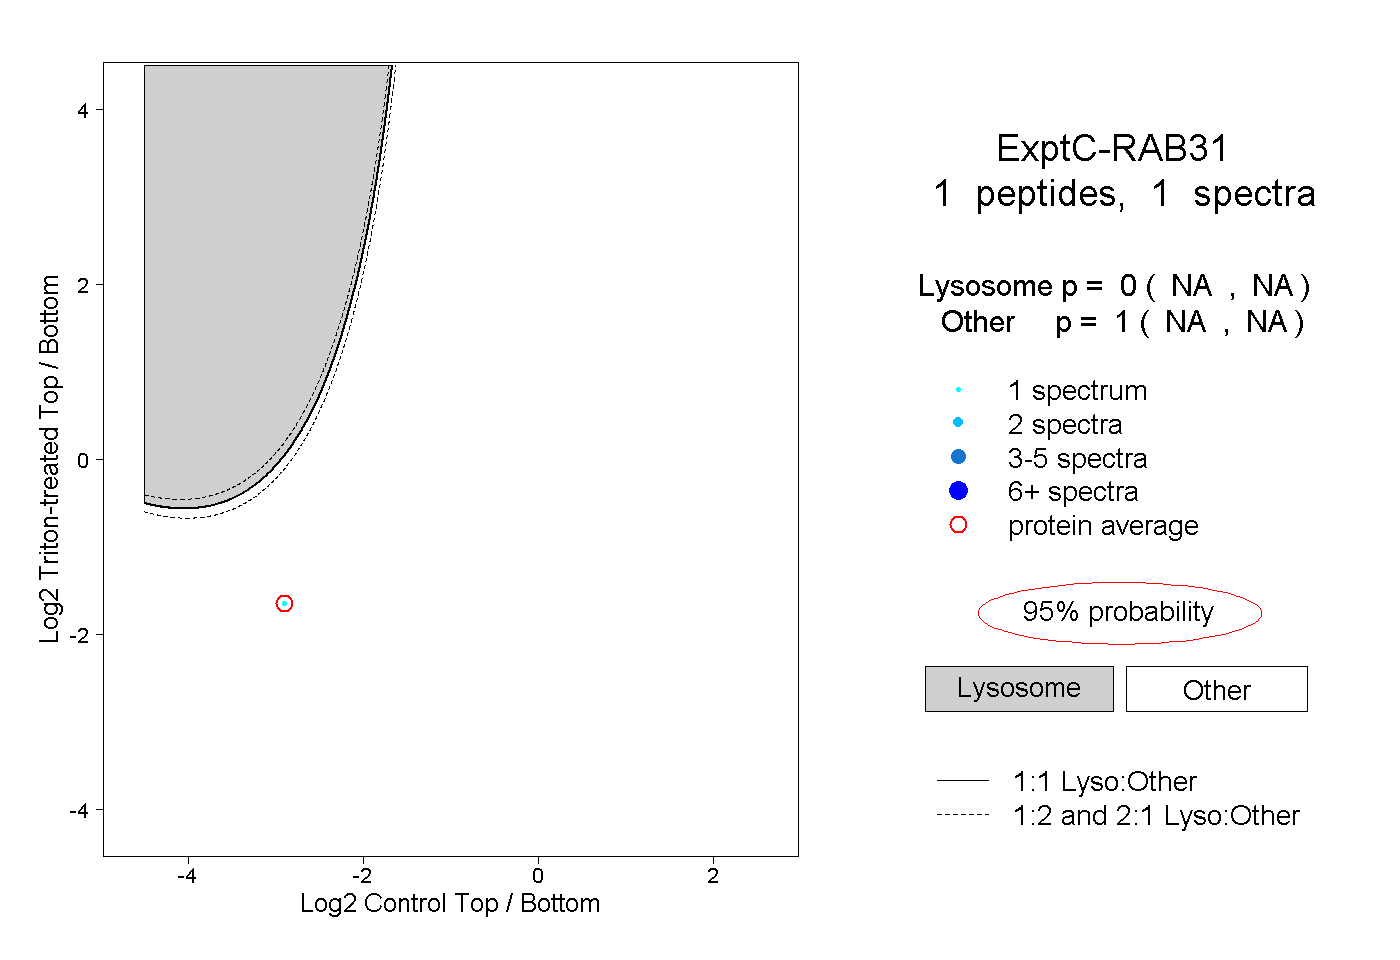 |
0.000 NA | NA |
1.000 NA | NA |