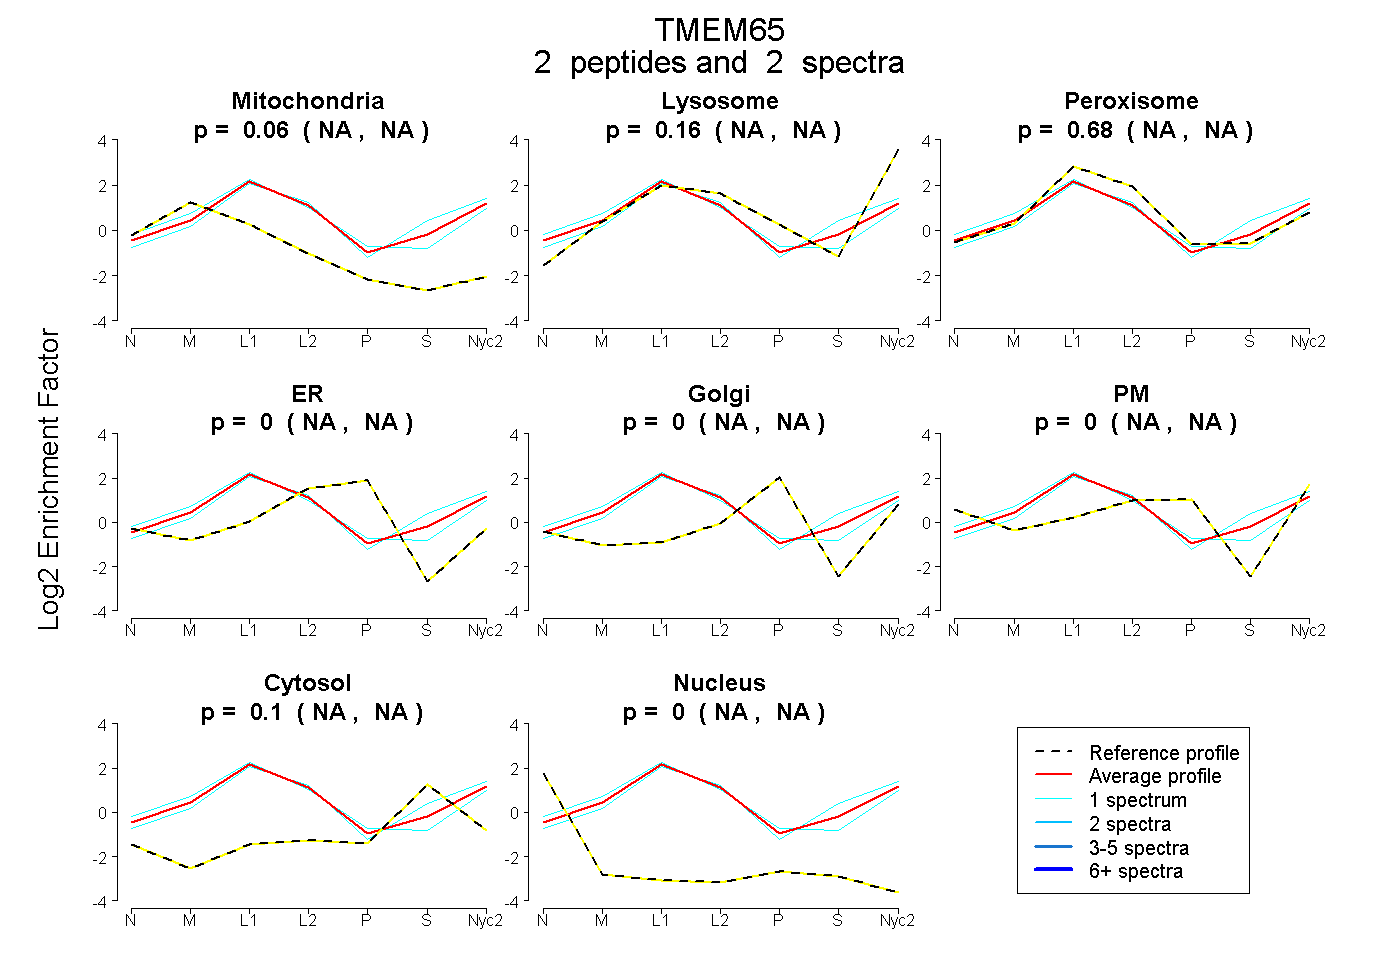
 2
2peptides
spectra
NA | NA
NA | NA
NA | NA
NA | NA
NA | NA
NA | NA
NA | NA
NA | NA
| Plot | Mito | Lyso | Perox | ER | Golgi | PM | Cytosol | Nucleus | |||||
| Expt A |
2 peptides |
2 spectra |
|
0.060 NA | NA |
0.159 NA | NA |
0.685 NA | NA |
0.000 NA | NA |
0.000 NA | NA |
0.000 NA | NA |
0.096 NA | NA |
0.000 NA | NA |
| 1 spectrum, QVDMWQTR | 0.173 | 0.159 | 0.638 | 0.000 | 0.000 | 0.031 | 0.000 | 0.000 | ||
| 1 spectrum, LGLSIPDLTPK | 0.000 | 0.165 | 0.665 | 0.000 | 0.000 | 0.000 | 0.170 | 0.000 |
| Plot | Lyso | Other | |||||||||||
| Expt C |
4 peptides |
14 spectra |
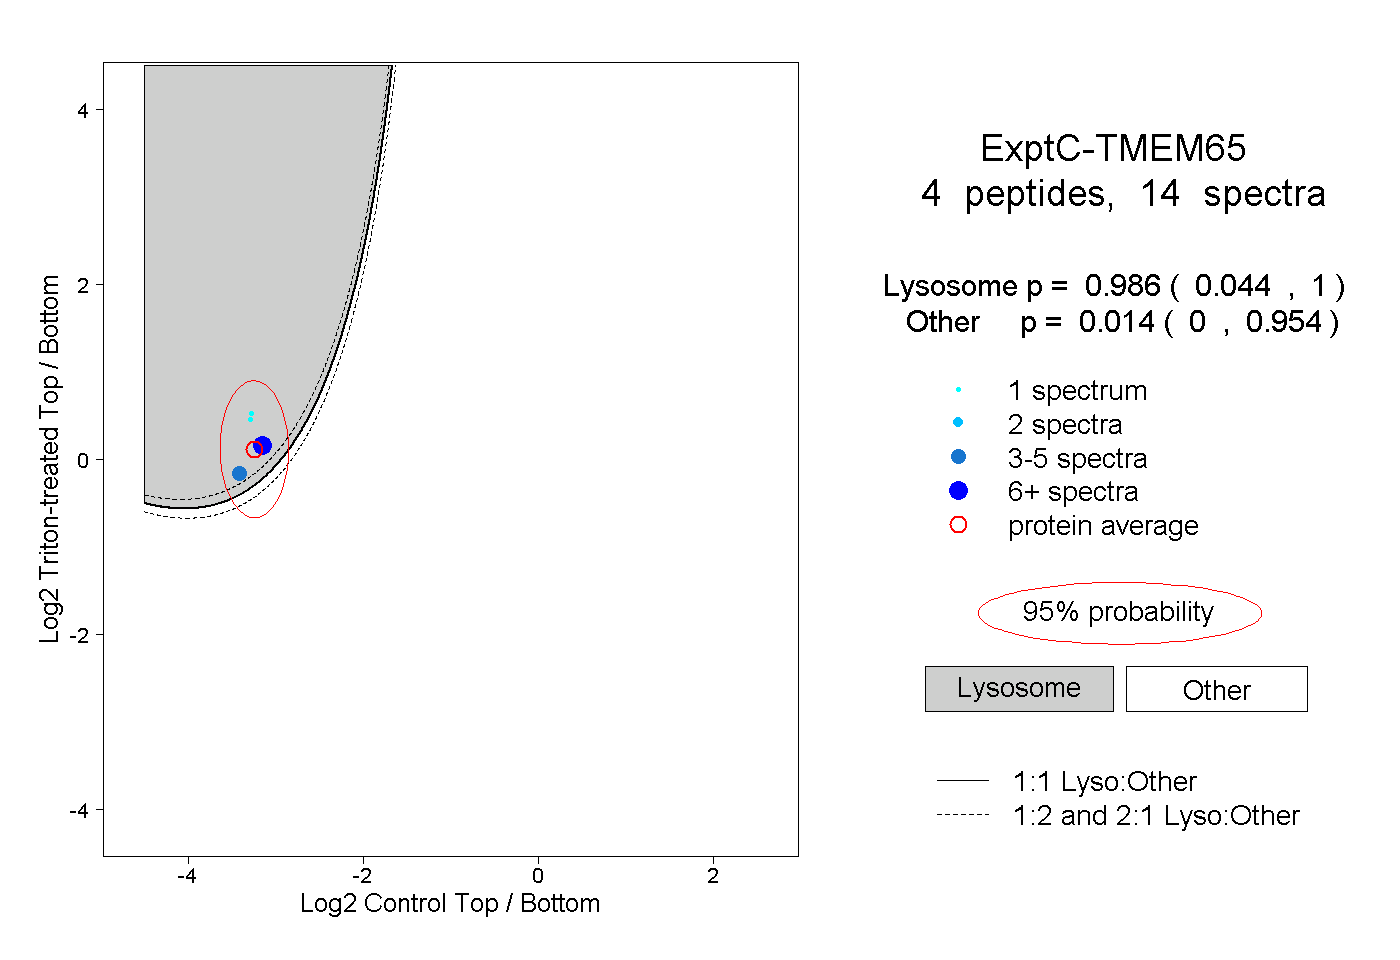 |
0.986 0.044 | 1.000 |
0.014 0.000 | 0.954 |