 2
2peptides
spectra
0.000 | 0.000
0.759 | 0.799
0.000 | 0.000
0.000 | 0.000
0.000 | 0.000
0.000 | 0.000
0.198 | 0.237
0.000 | 0.000
| Plot | Mito | Lyso | Perox | ER | Golgi | PM | Cytosol | Nucleus | |||||
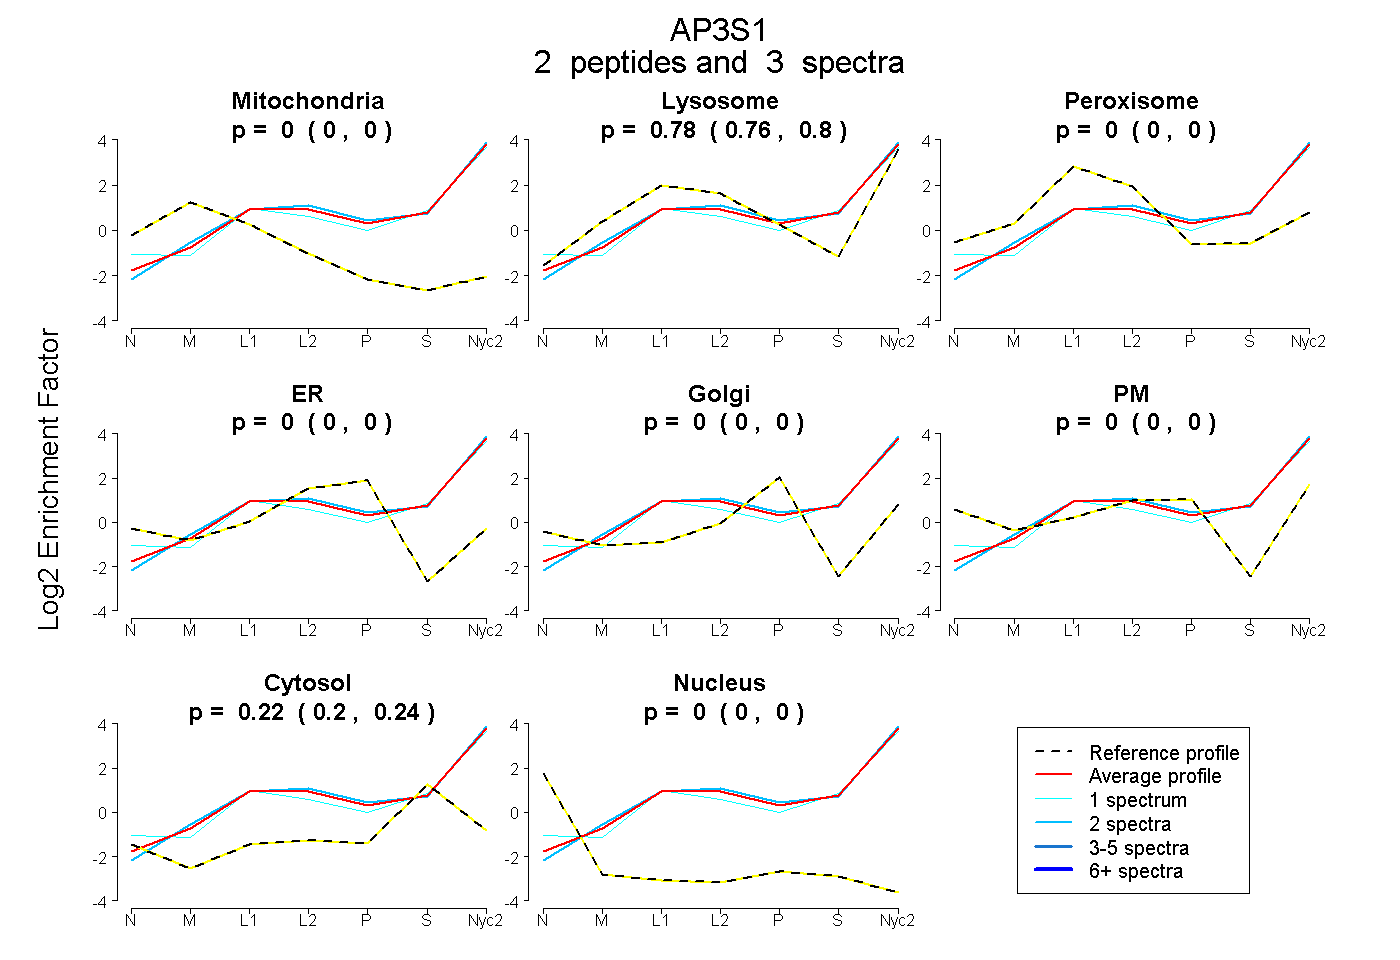
| Expt A |
2 peptides |
3 spectra |
|
0.000 0.000 | 0.000 |
0.780 0.759 | 0.799 |
0.000 0.000 | 0.000 |
0.000 0.000 | 0.000 |
0.000 0.000 | 0.000 |
0.000 0.000 | 0.000 |
0.220 0.198 | 0.237 |
0.000 0.000 | 0.000 |
| 2 spectra, AILIFNNHGKPR | 0.000 | 0.810 | 0.000 | 0.000 | 0.000 | 0.000 | 0.190 | 0.000 | ||
| 1 spectrum, ETFHLVSK | 0.000 | 0.722 | 0.000 | 0.000 | 0.000 | 0.000 | 0.278 | 0.000 |
| Plot | Mito | Lyso or Perox | ER | Golgi | PM | Cytosol | Nucleus | ||||||
| Expt B |
1 peptide |
4 spectra |
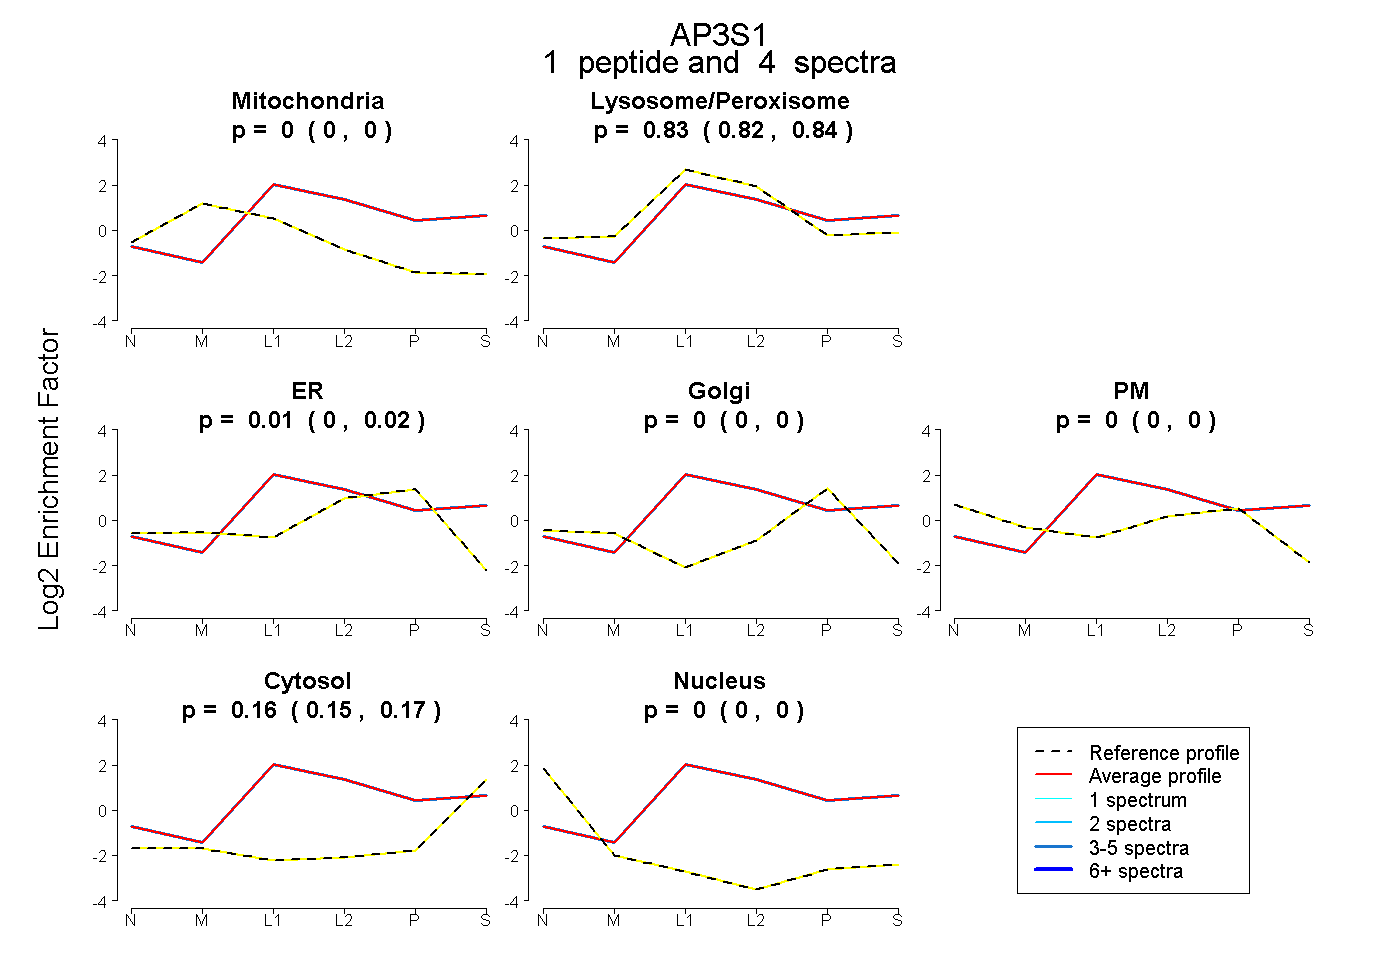 |
0.000 0.000 | 0.000 |
0.832 0.818 | 0.841 |
0.007 0.000 | 0.019 |
0.000 0.000 | 0.001 |
0.000 0.000 | 0.000 |
0.161 0.149 | 0.171 |
0.000 0.000 | 0.000 |
|||
| Plot | Lyso | Other | |||||||||||
| Expt C |
2 peptides |
2 spectra |
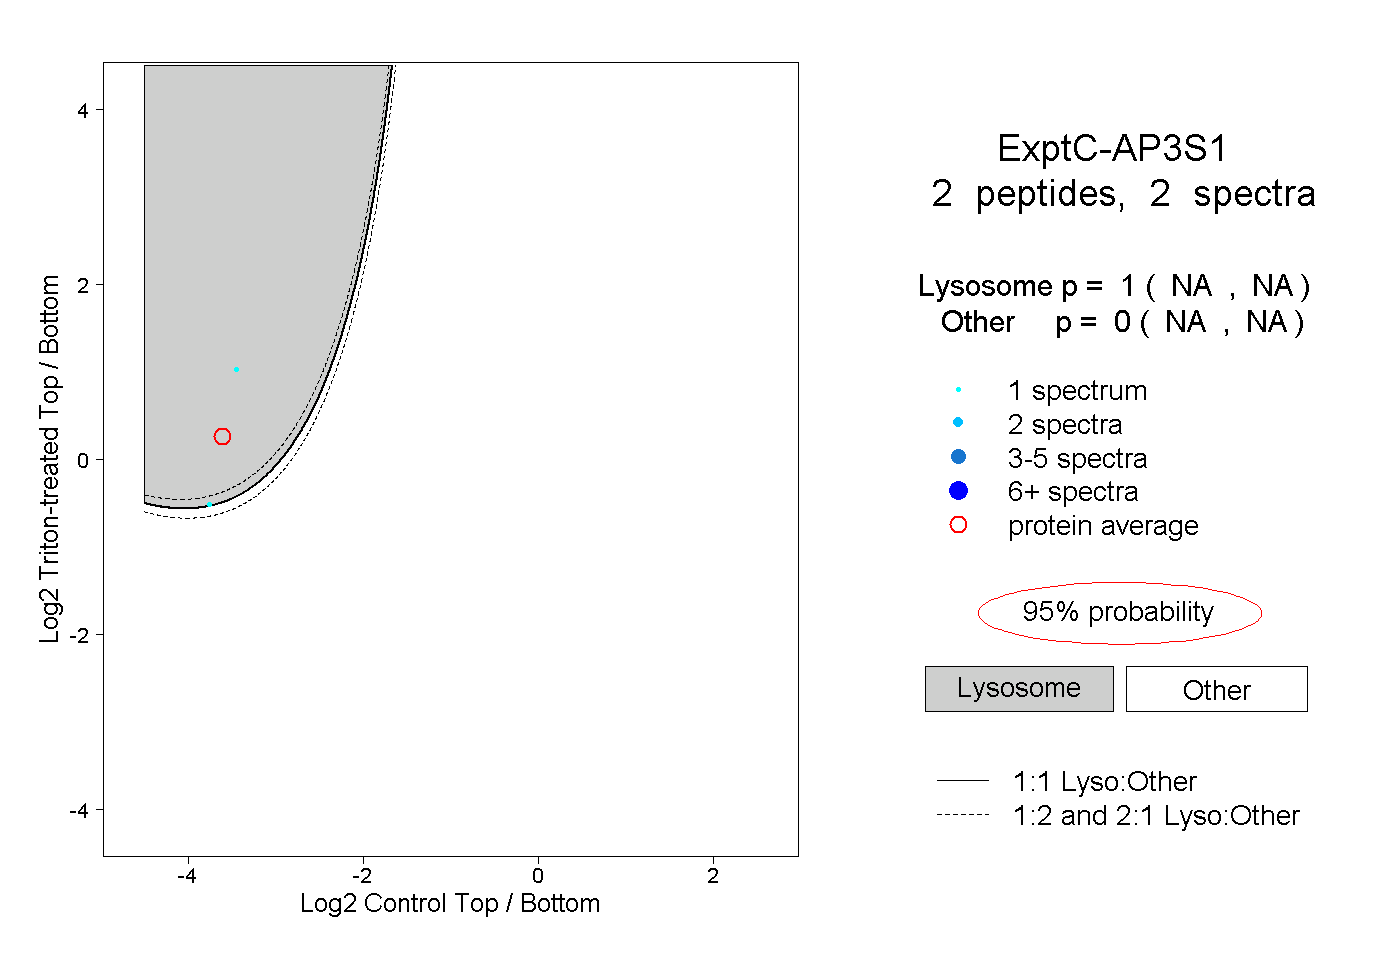 |
1.000 NA | NA |
0.000 NA | NA |
||||||||
| Plot | Lyso | Other | |||||||||||
| Expt D |
2 peptides |
2 spectra |
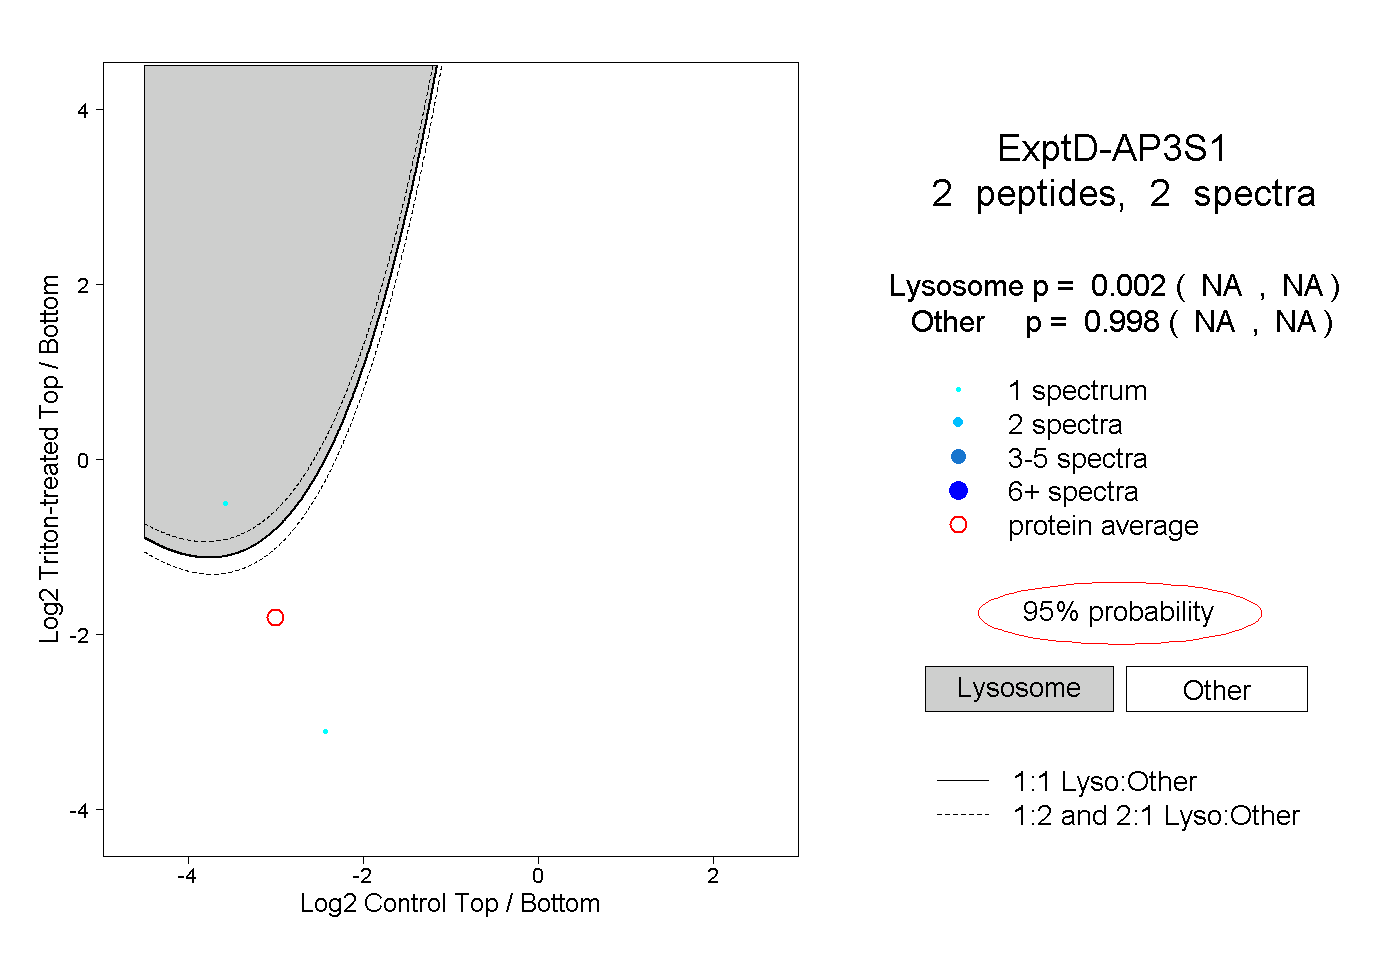 |
0.002 NA | NA |
0.998 NA | NA |