 2
2peptides
spectra
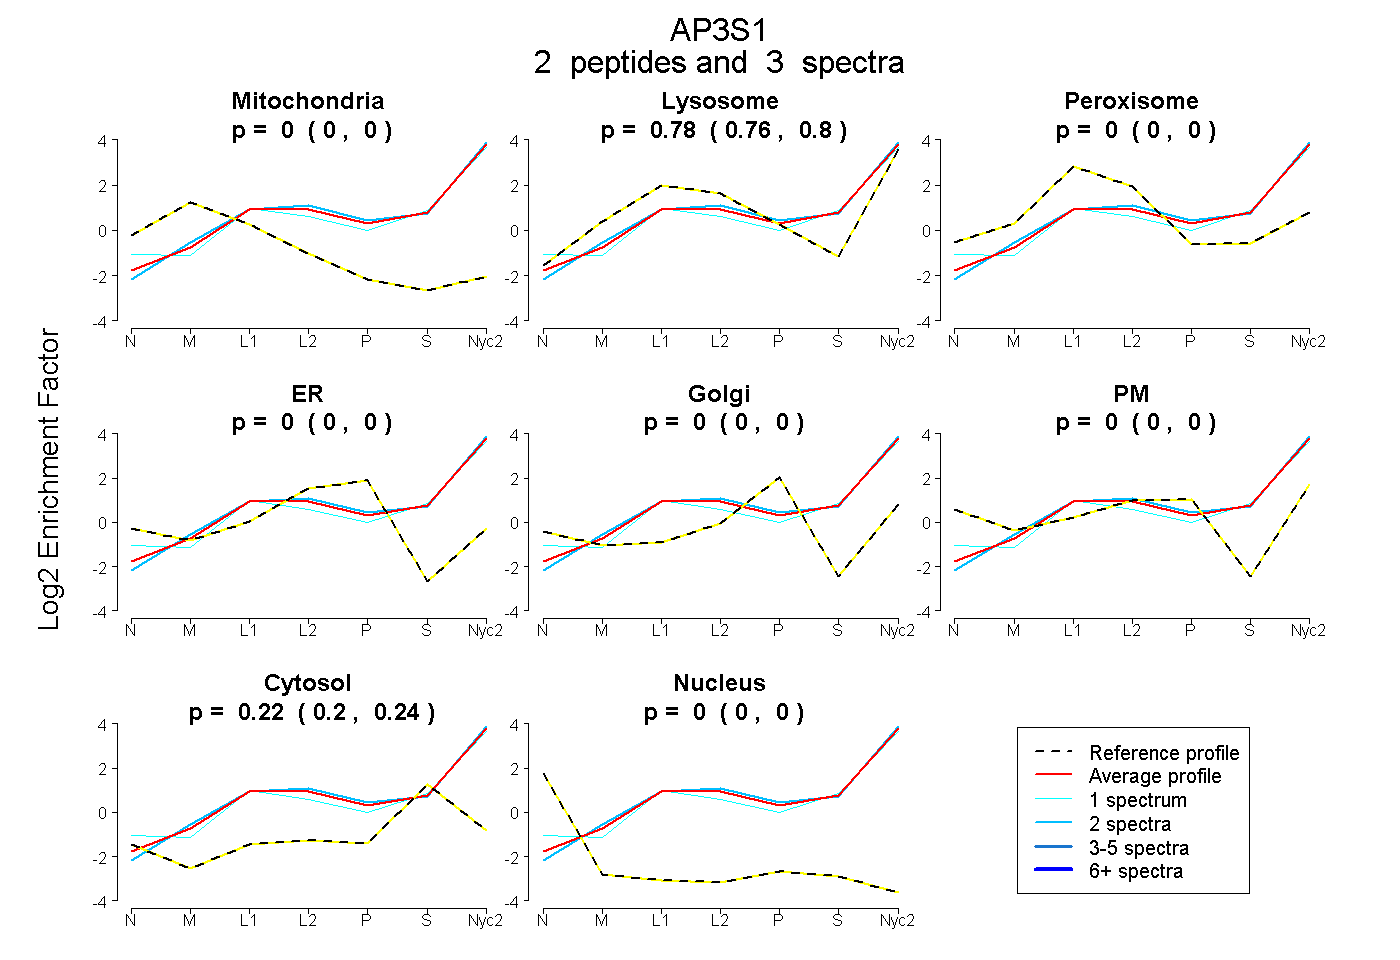
0.000 | 0.000
0.759 | 0.799
0.000 | 0.000
0.000 | 0.000
0.000 | 0.000
0.000 | 0.000
0.198 | 0.237
0.000 | 0.000
1peptide
spectra
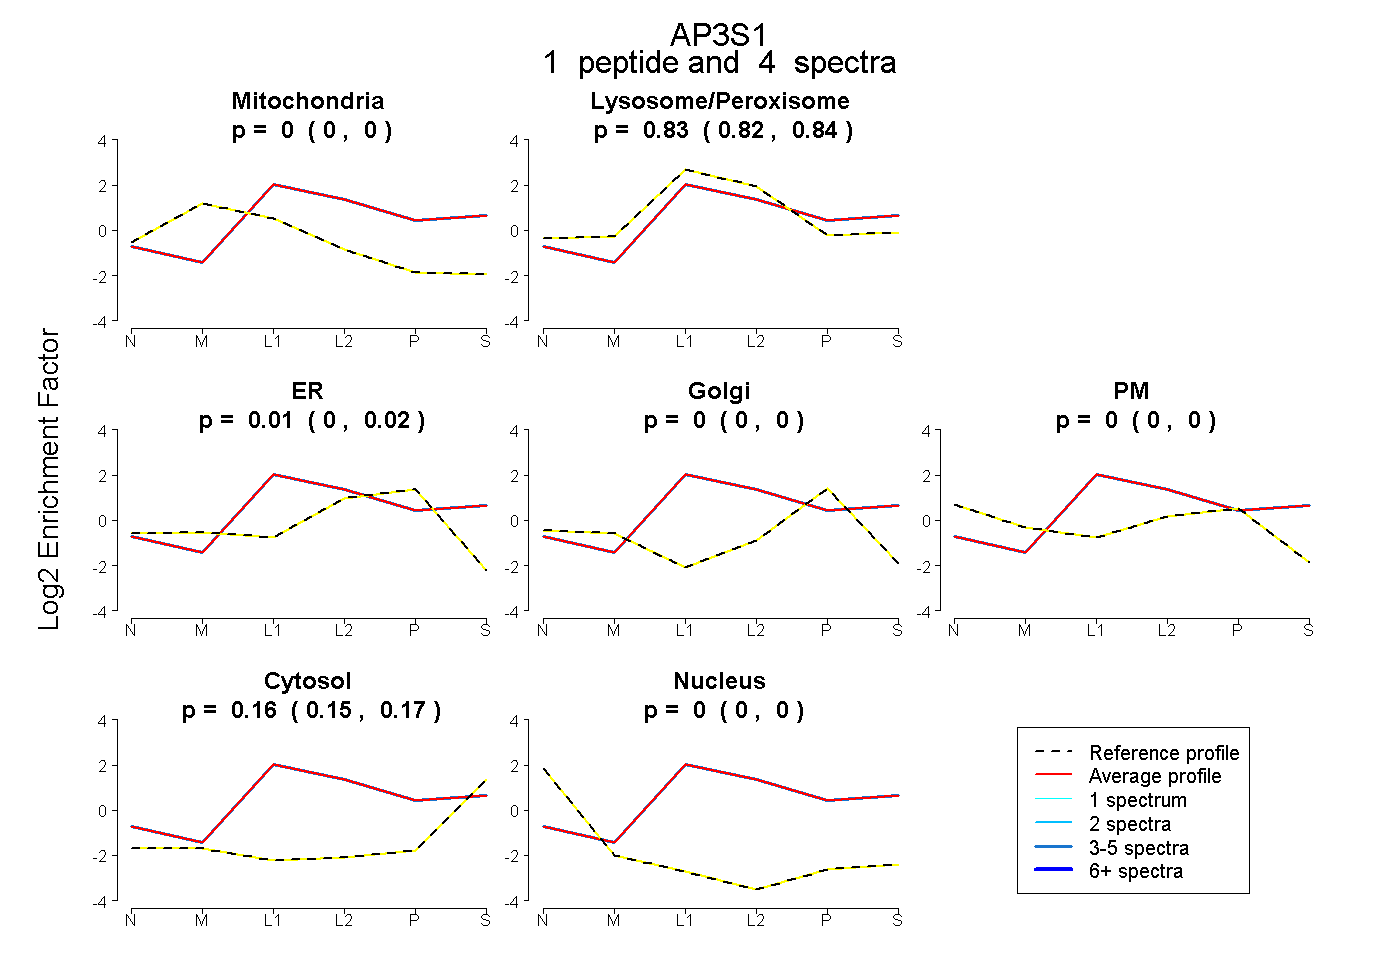
0.000 | 0.000
0.818 | 0.841
0.000 | 0.019
0.000 | 0.001
0.000 | 0.000
0.149 | 0.171
0.000 | 0.000
2peptides
spectra
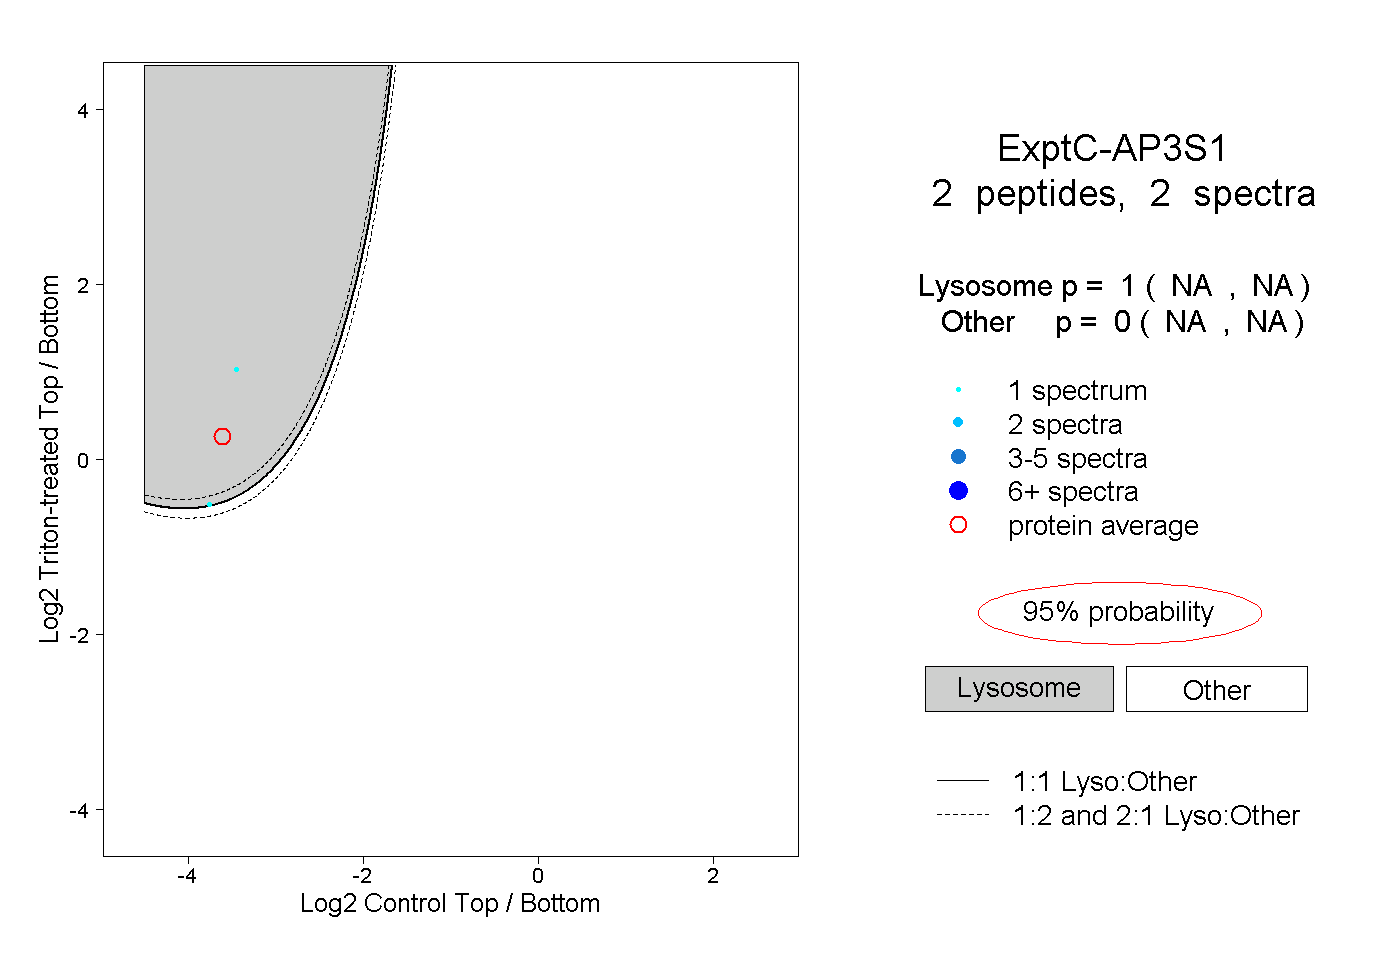
NA | NA
NA | NA
2peptides
spectra
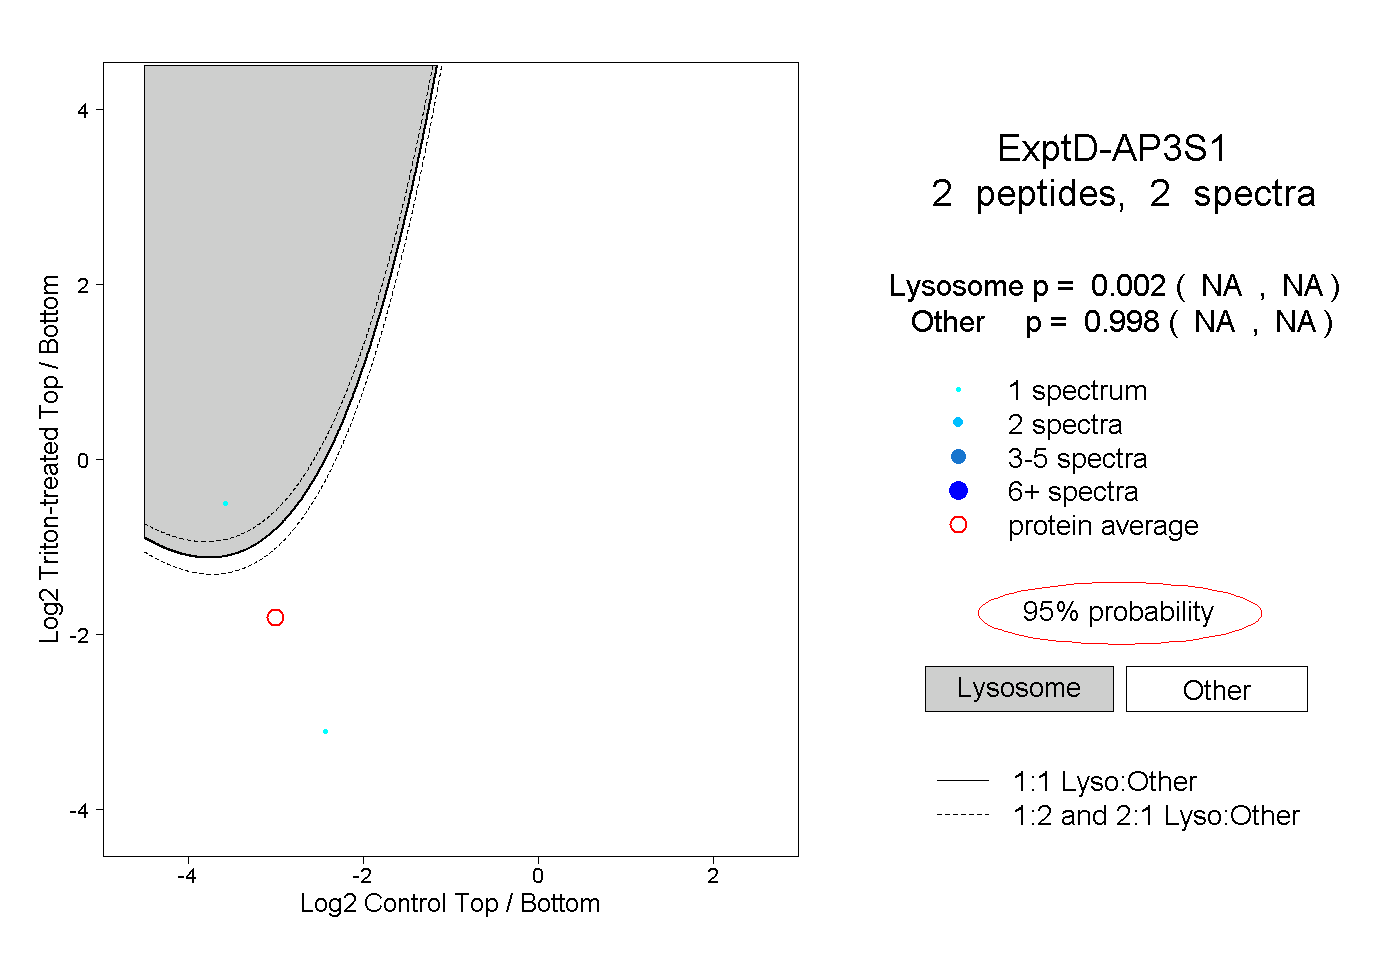
NA | NA
NA | NA