 7
7peptides
spectra
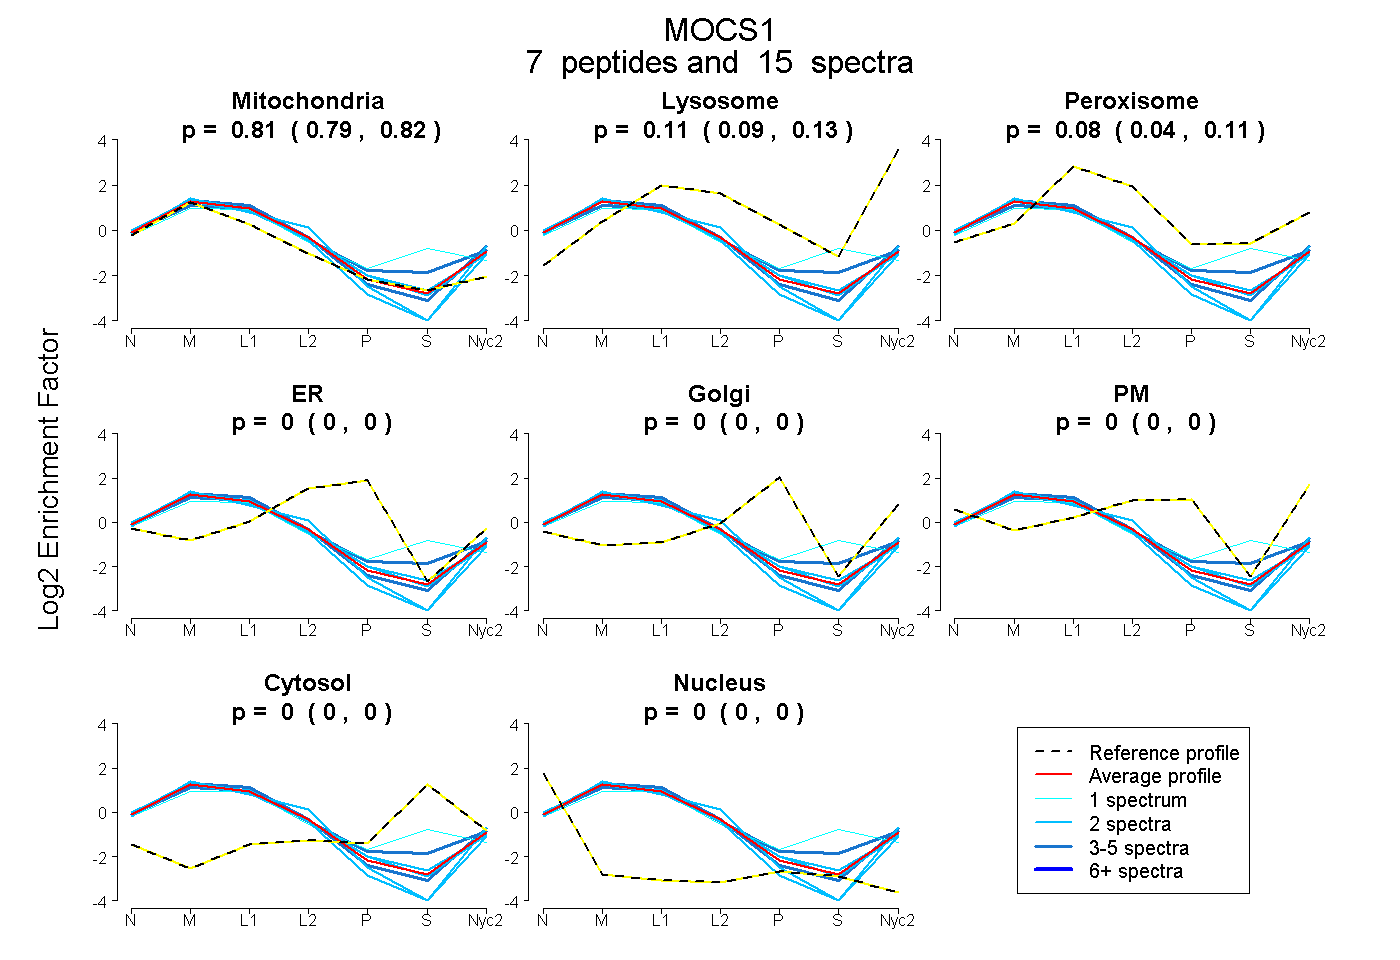
0.788 | 0.821
0.091 | 0.132
0.043 | 0.114
0.000 | 0.000
0.000 | 0.000
0.000 | 0.000
0.000 | 0.000
0.000 | 0.000
4peptides
spectra
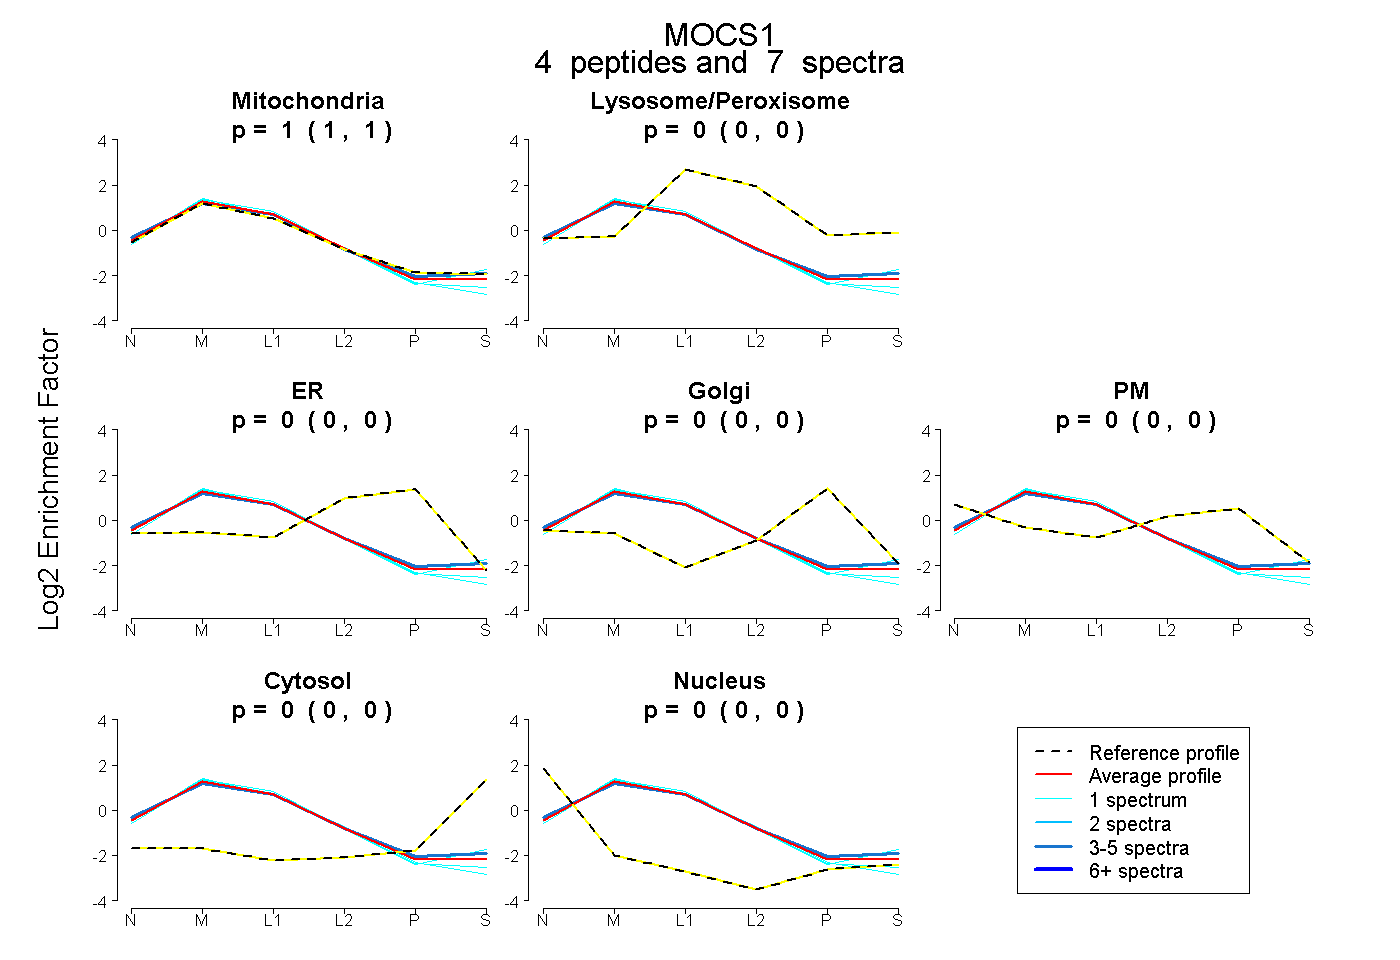
0.995 | 1.000
0.000 | 0.001
0.000 | 0.000
0.000 | 0.000
0.000 | 0.000
0.000 | 0.000
0.000 | 0.000
16peptides
spectra
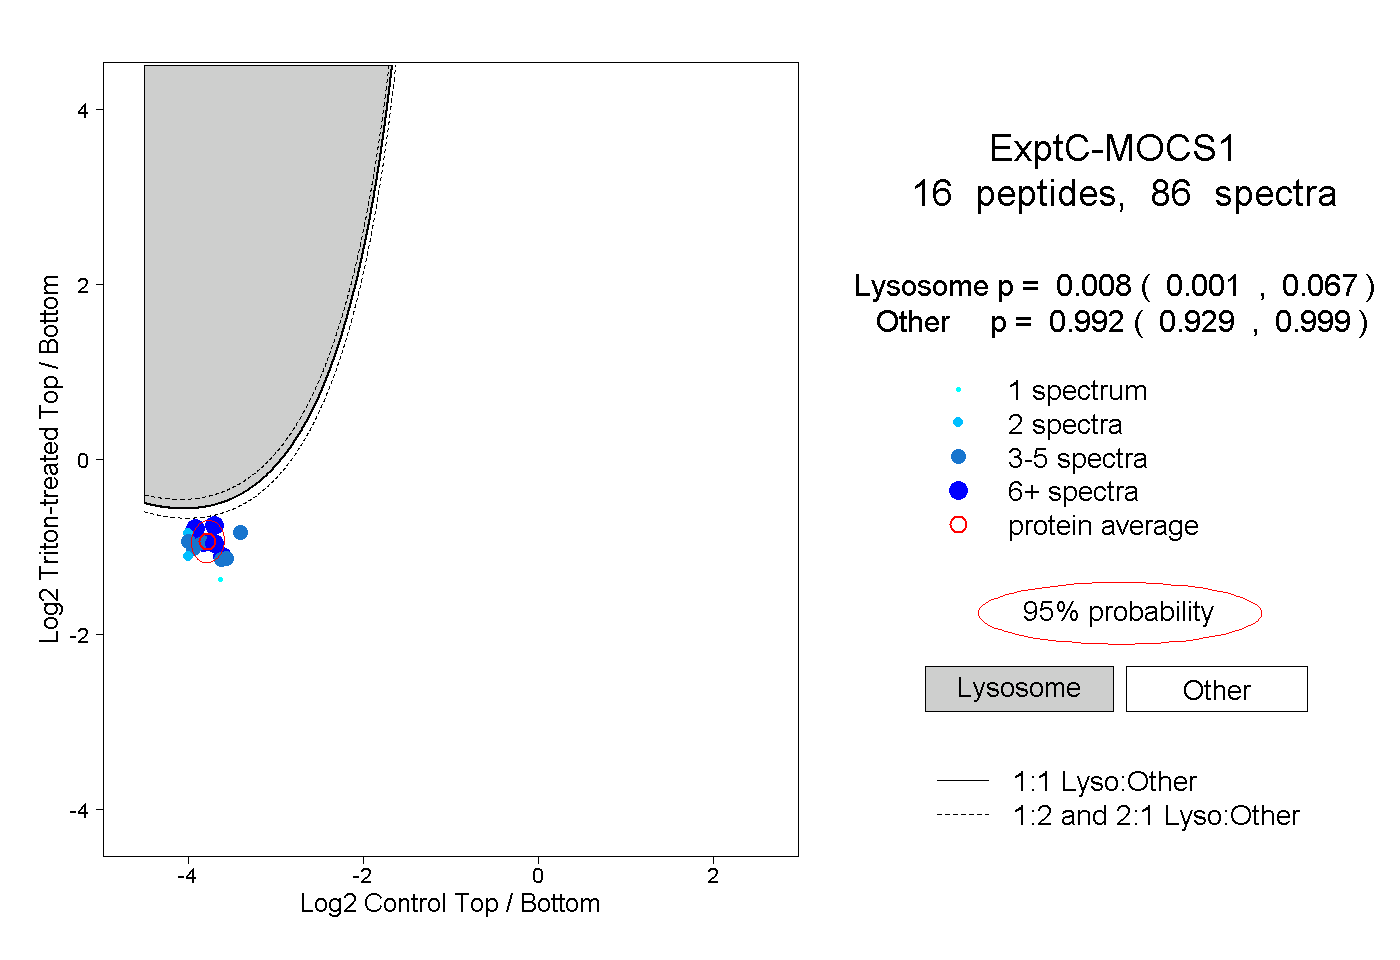
0.001 | 0.067
0.929 | 0.999
