 7
7peptides
spectra
0.788 | 0.821
0.091 | 0.132
0.043 | 0.114
0.000 | 0.000
0.000 | 0.000
0.000 | 0.000
0.000 | 0.000
0.000 | 0.000
| Plot | Mito | Lyso | Perox | ER | Golgi | PM | Cytosol | Nucleus | |||||
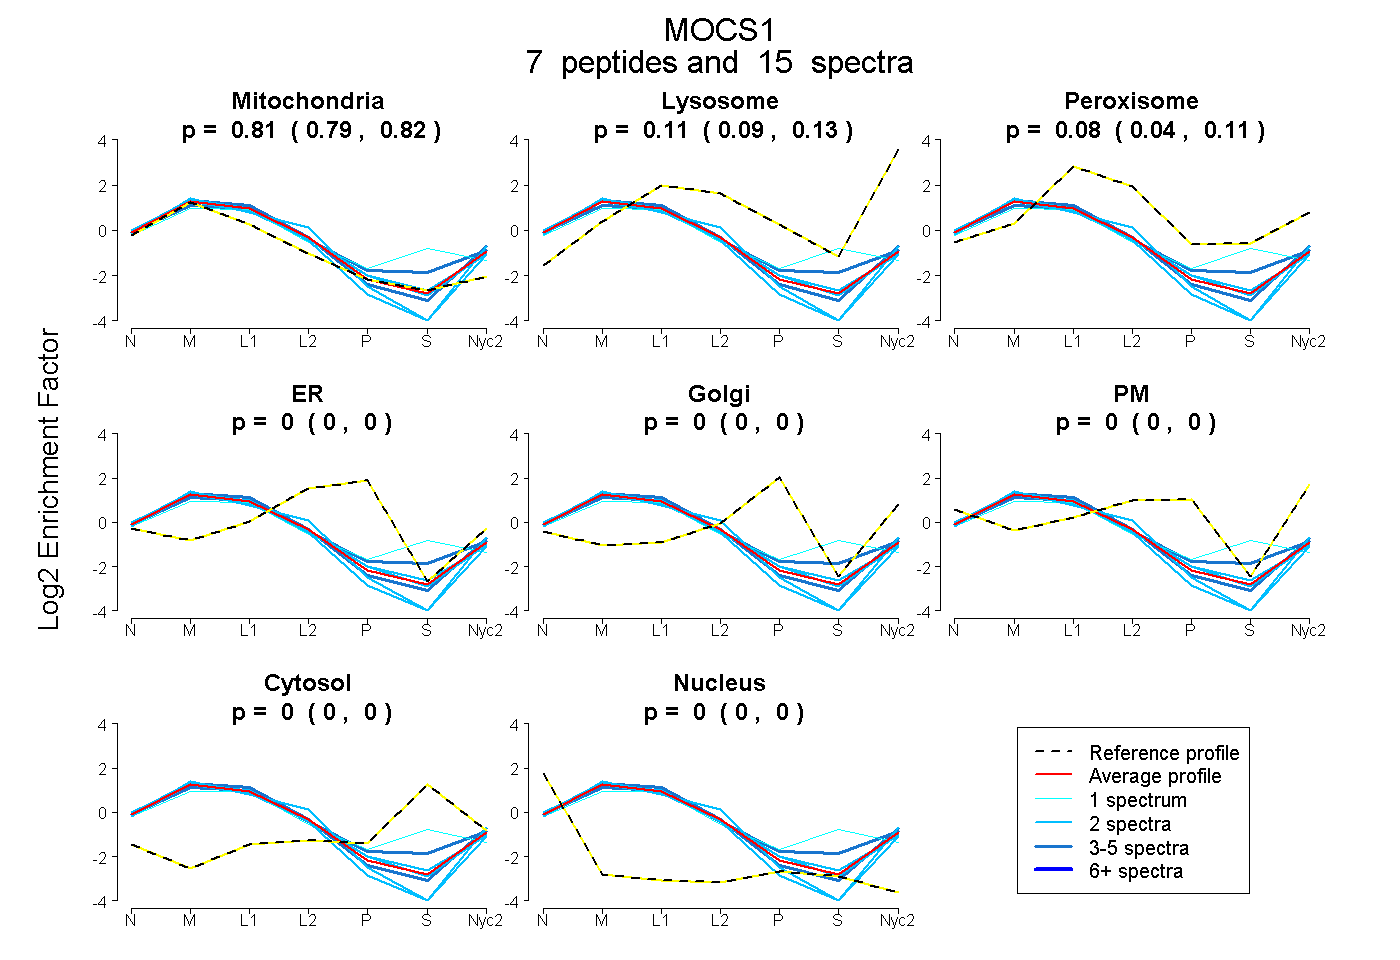
| Expt A |
7 peptides |
15 spectra |
|
0.806 0.788 | 0.821 |
0.114 0.091 | 0.132 |
0.080 0.043 | 0.114 |
0.000 0.000 | 0.000 |
0.000 0.000 | 0.000 |
0.000 0.000 | 0.000 |
0.000 0.000 | 0.000 |
0.000 0.000 | 0.000 |
| 2 spectra, TIGVTTNGINLAR | 0.833 | 0.149 | 0.000 | 0.000 | 0.000 | 0.018 | 0.000 | 0.000 | ||
| 2 spectra, VNCVVMR | 0.800 | 0.087 | 0.113 | 0.000 | 0.000 | 0.000 | 0.000 | 0.000 | ||
| 3 spectra, AGASEEELLR | 0.706 | 0.063 | 0.226 | 0.000 | 0.000 | 0.000 | 0.003 | 0.002 | ||
| 2 spectra, IIGVAVGR | 0.806 | 0.093 | 0.054 | 0.000 | 0.000 | 0.046 | 0.000 | 0.000 | ||
| 1 spectrum, LPEEDSSTAK | 0.588 | 0.000 | 0.268 | 0.000 | 0.000 | 0.000 | 0.144 | 0.000 | ||
| 3 spectra, ADLLTTEEILTLAR | 0.811 | 0.150 | 0.039 | 0.000 | 0.000 | 0.000 | 0.000 | 0.000 | ||
| 2 spectra, LTGGEPLIRPDVVDIVAR | 0.923 | 0.077 | 0.000 | 0.000 | 0.000 | 0.000 | 0.000 | 0.000 |
| Plot | Mito | Lyso or Perox | ER | Golgi | PM | Cytosol | Nucleus | ||||||
| Expt B |
4 peptides |
7 spectra |
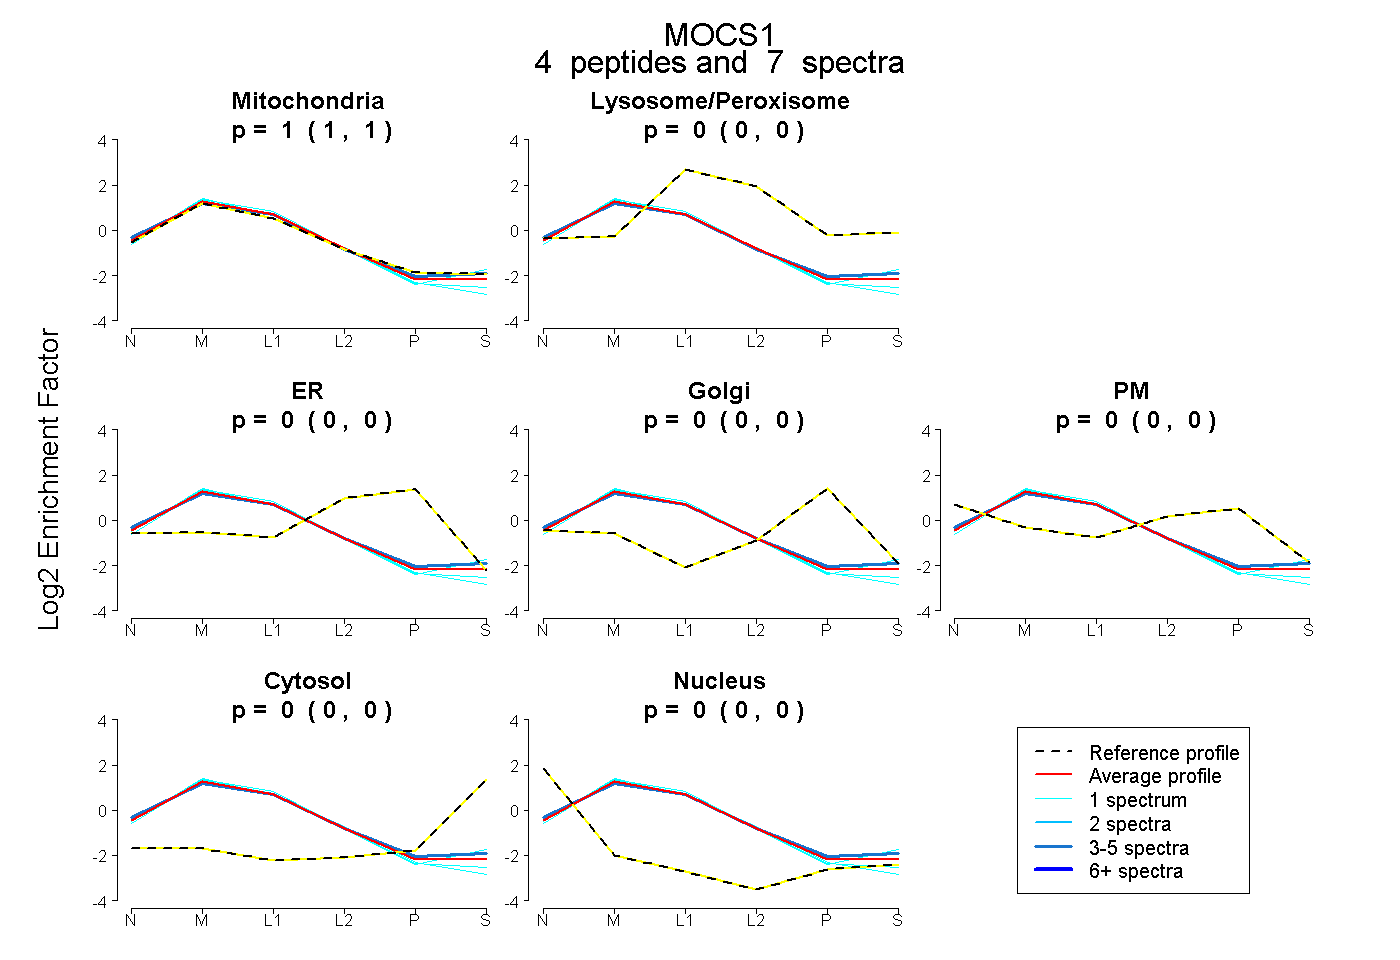 |
1.000 0.995 | 1.000 |
0.000 0.000 | 0.001 |
0.000 0.000 | 0.000 |
0.000 0.000 | 0.000 |
0.000 0.000 | 0.000 |
0.000 0.000 | 0.000 |
0.000 0.000 | 0.000 |
|||
| Plot | Lyso | Other | |||||||||||
| Expt C |
16 peptides |
86 spectra |
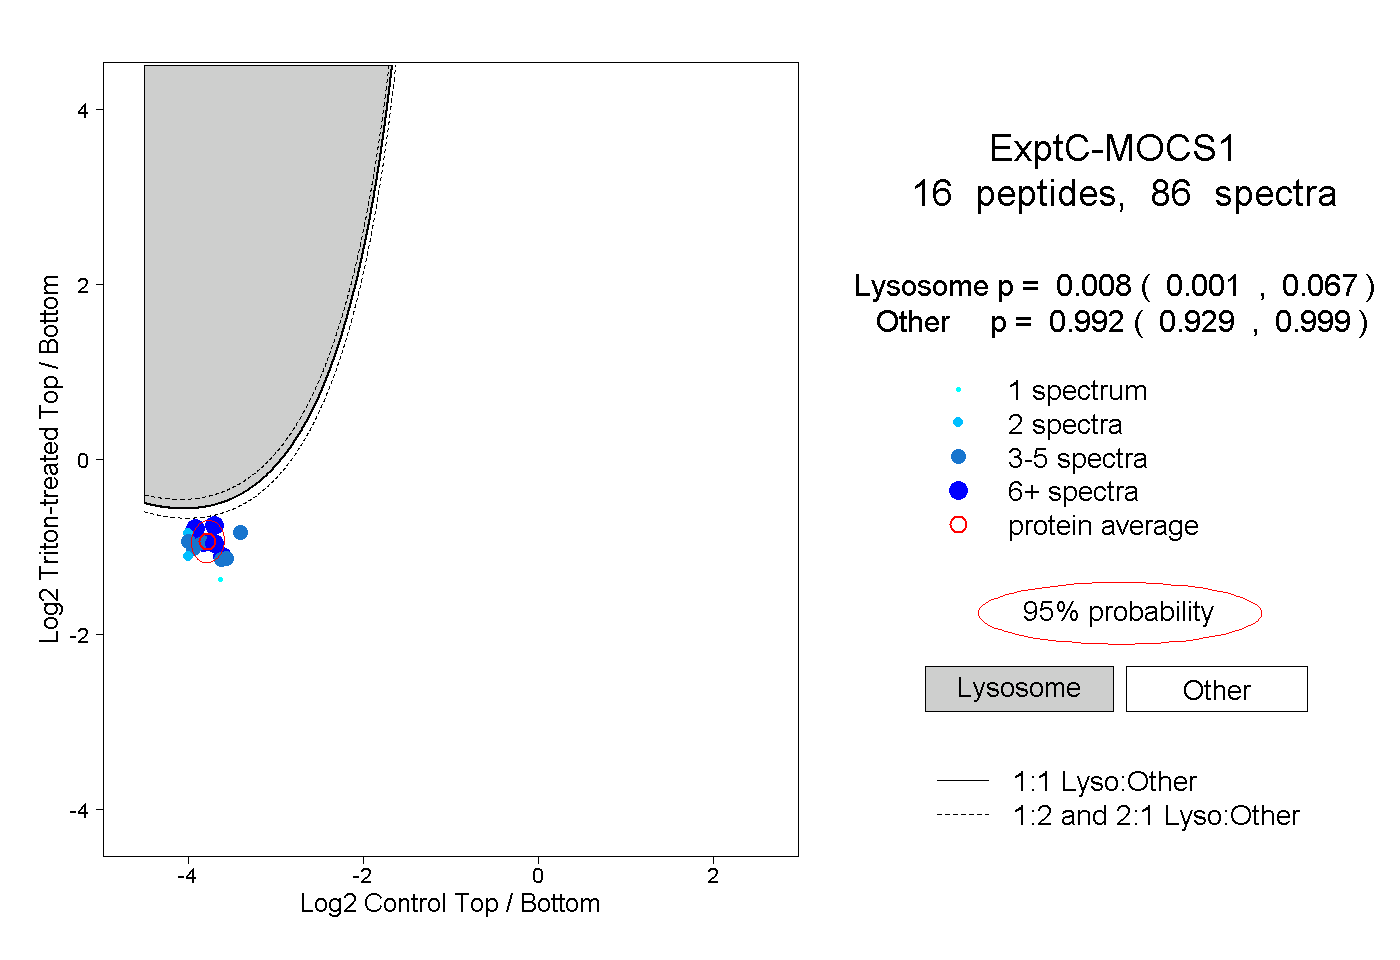 |
0.008 0.001 | 0.067 |
0.992 0.929 | 0.999 |
||||||||
| Plot | Lyso | Other | |||||||||||
| Expt D |
2 peptides |
2 spectra |
 |
0.000 NA | NA |
1.000 NA | NA |