 11
11peptides
spectra
0.000 | 0.000
0.892 | 0.911
0.000 | 0.000
0.000 | 0.000
0.000 | 0.000
0.087 | 0.106
0.000 | 0.000
0.000 | 0.000
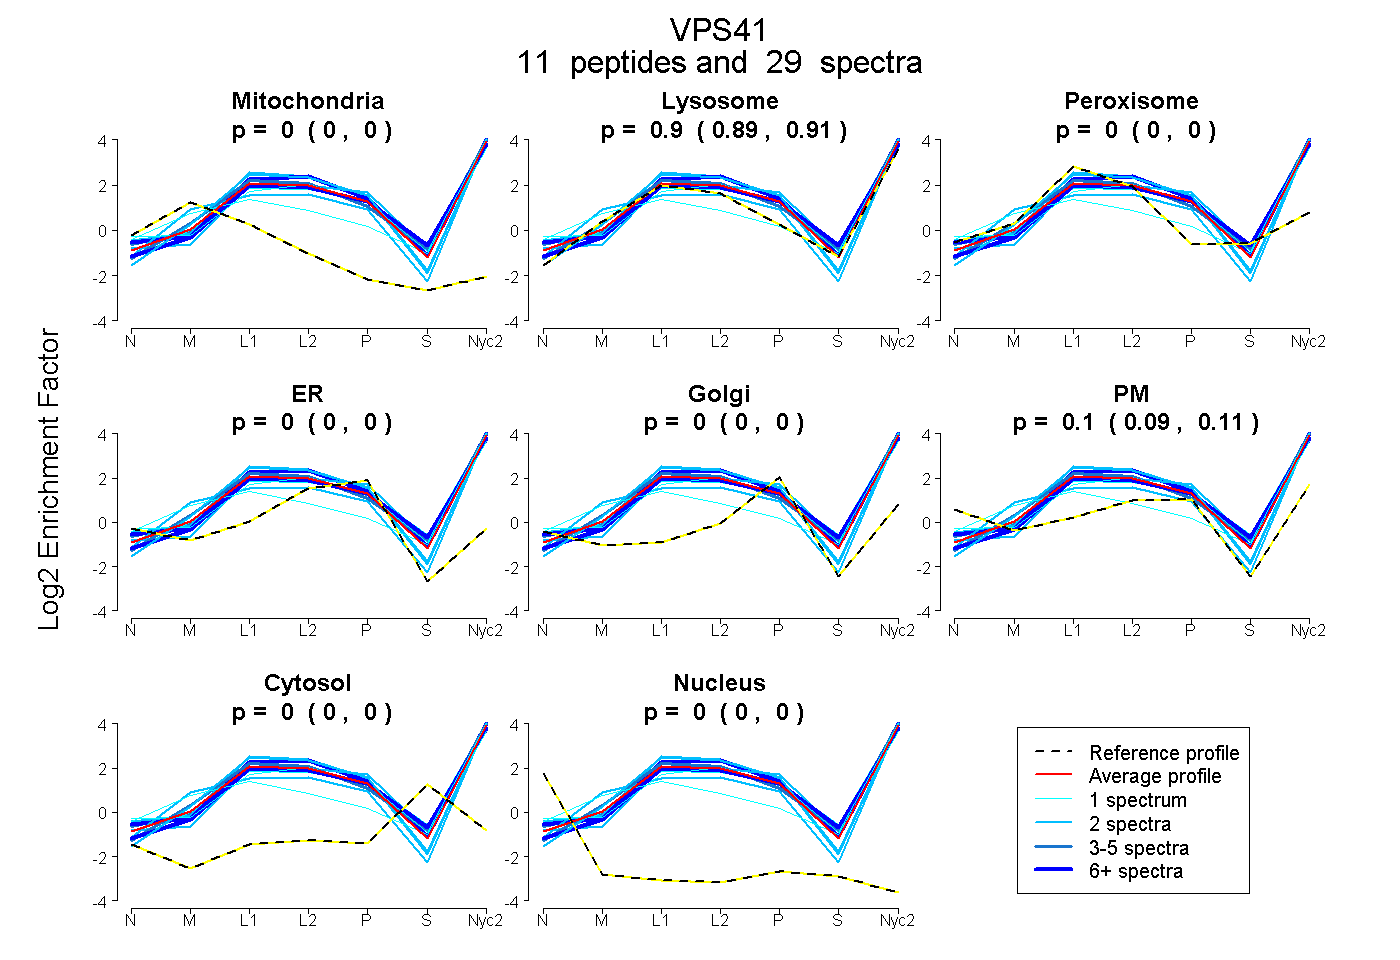
| Plot | Mito | Lyso | Perox | ER | Golgi | PM | Cytosol | Nucleus | |||||
| Expt A |
11 peptides |
29 spectra |
|
0.000 0.000 | 0.000 |
0.903 0.892 | 0.911 |
0.000 0.000 | 0.000 |
0.000 0.000 | 0.000 |
0.000 0.000 | 0.000 |
0.097 0.087 | 0.106 |
0.000 0.000 | 0.000 |
0.000 0.000 | 0.000 |
| 6 spectra, MIMEELHDVDK | 0.000 | 0.940 | 0.000 | 0.000 | 0.060 | 0.000 | 0.000 | 0.000 | ||
| 2 spectra, ALEICQQR | 0.000 | 0.832 | 0.000 | 0.000 | 0.000 | 0.168 | 0.000 | 0.000 | ||
| 3 spectra, AISPYLPR | 0.000 | 0.862 | 0.000 | 0.000 | 0.000 | 0.138 | 0.000 | 0.000 | ||
| 6 spectra, GEYDMAAR | 0.000 | 0.881 | 0.000 | 0.000 | 0.000 | 0.119 | 0.000 | 0.000 | ||
| 1 spectrum, DVFQLIHK | 0.000 | 0.965 | 0.000 | 0.000 | 0.035 | 0.000 | 0.000 | 0.000 | ||
| 3 spectra, IVAVHPQFVR | 0.000 | 1.000 | 0.000 | 0.000 | 0.000 | 0.000 | 0.000 | 0.000 | ||
| 1 spectrum, TLAELYTYDK | 0.000 | 0.793 | 0.000 | 0.000 | 0.000 | 0.191 | 0.000 | 0.016 | ||
| 2 spectra, ITNVPR | 0.000 | 0.829 | 0.000 | 0.000 | 0.000 | 0.171 | 0.000 | 0.000 | ||
| 2 spectra, GFQENECR | 0.000 | 0.867 | 0.000 | 0.000 | 0.018 | 0.115 | 0.000 | 0.000 | ||
| 2 spectra, NFVEETVYLLSR | 0.000 | 0.980 | 0.000 | 0.020 | 0.000 | 0.000 | 0.000 | 0.000 | ||
| 1 spectrum, QFVTGGK | 0.000 | 0.790 | 0.000 | 0.000 | 0.000 | 0.210 | 0.000 | 0.000 |
| Plot | Mito | Lyso or Perox | ER | Golgi | PM | Cytosol | Nucleus | ||||||
| Expt B |
3 peptides |
3 spectra |
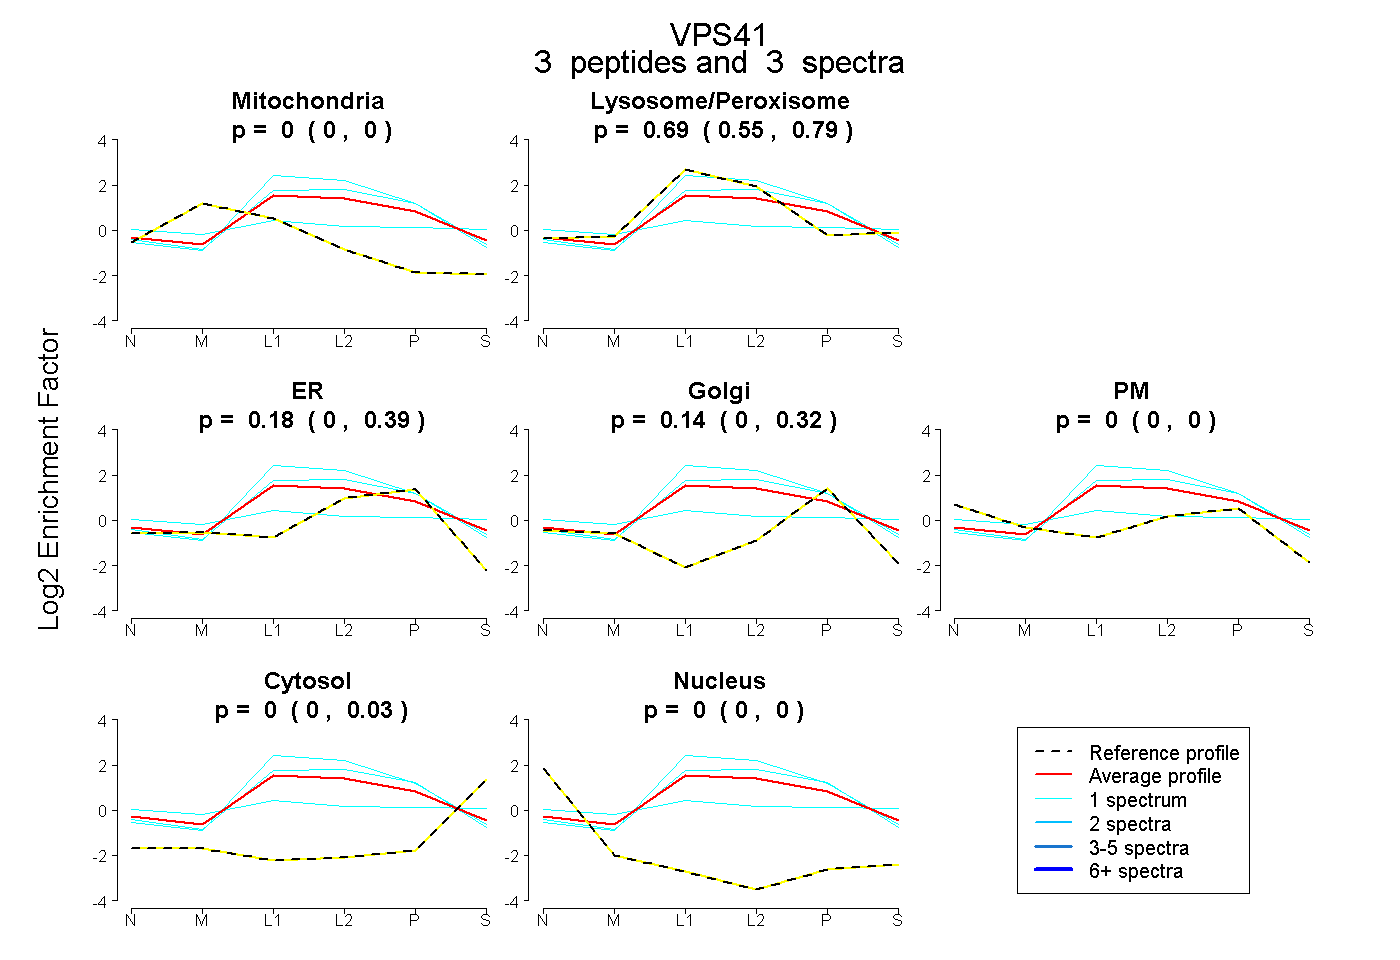 |
0.000 0.000 | 0.000 |
0.688 0.546 | 0.790 |
0.176 0.000 | 0.390 |
0.136 0.000 | 0.318 |
0.000 0.000 | 0.000 |
0.000 0.000 | 0.034 |
0.000 0.000 | 0.000 |
|||
| Plot | Lyso | Other | |||||||||||
| Expt C |
22 peptides |
105 spectra |
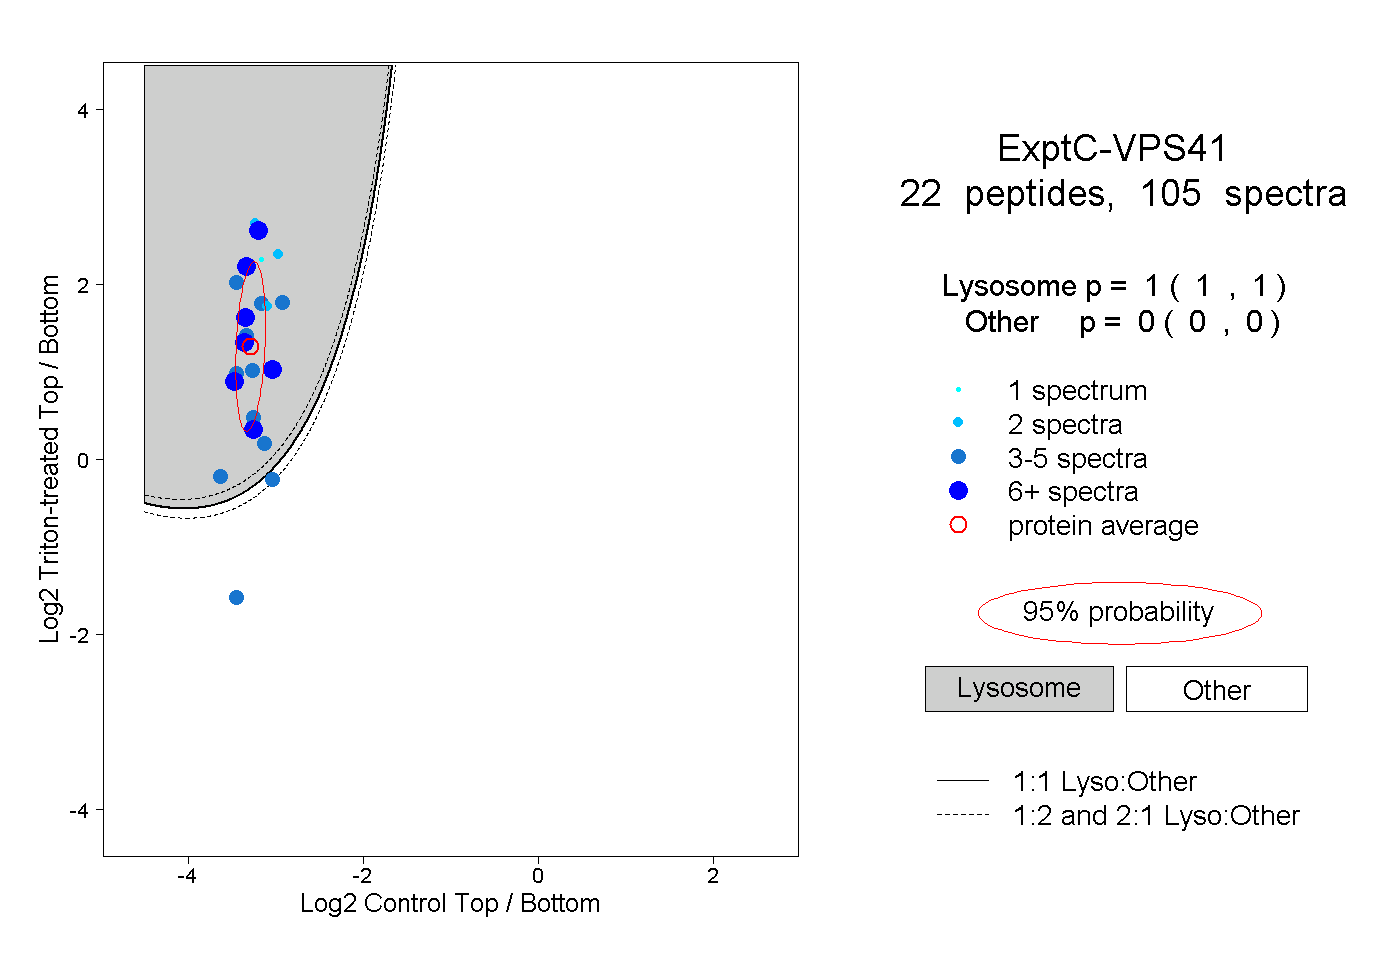 |
1.000 1.000 | 1.000 |
0.000 0.000 | 0.000 |
||||||||
| Plot | Lyso | Other | |||||||||||
| Expt D |
3 peptides |
3 spectra |
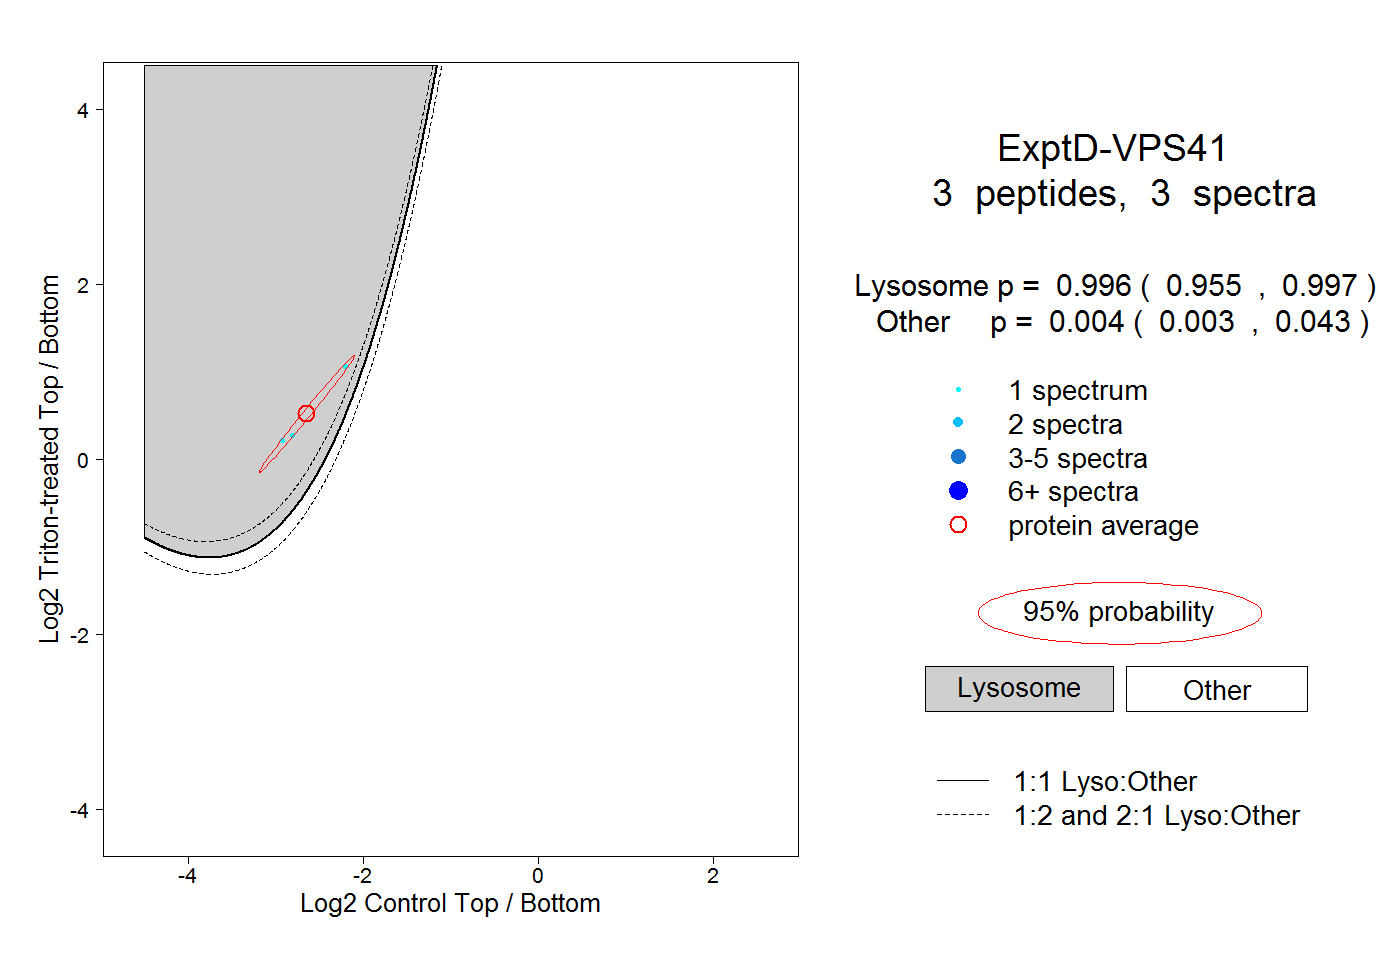 |
0.996 0.955 | 0.997 |
0.004 0.003 | 0.043 |