ATL3
[ENSRNOP00000063444]
Main page
| | | Plot |
Mito |
Lyso |
|
Perox |
ER |
Golgi |
PM |
Cytosol |
Nucleus |
|
| Expt A |
 16
16
peptides |
111
spectra |
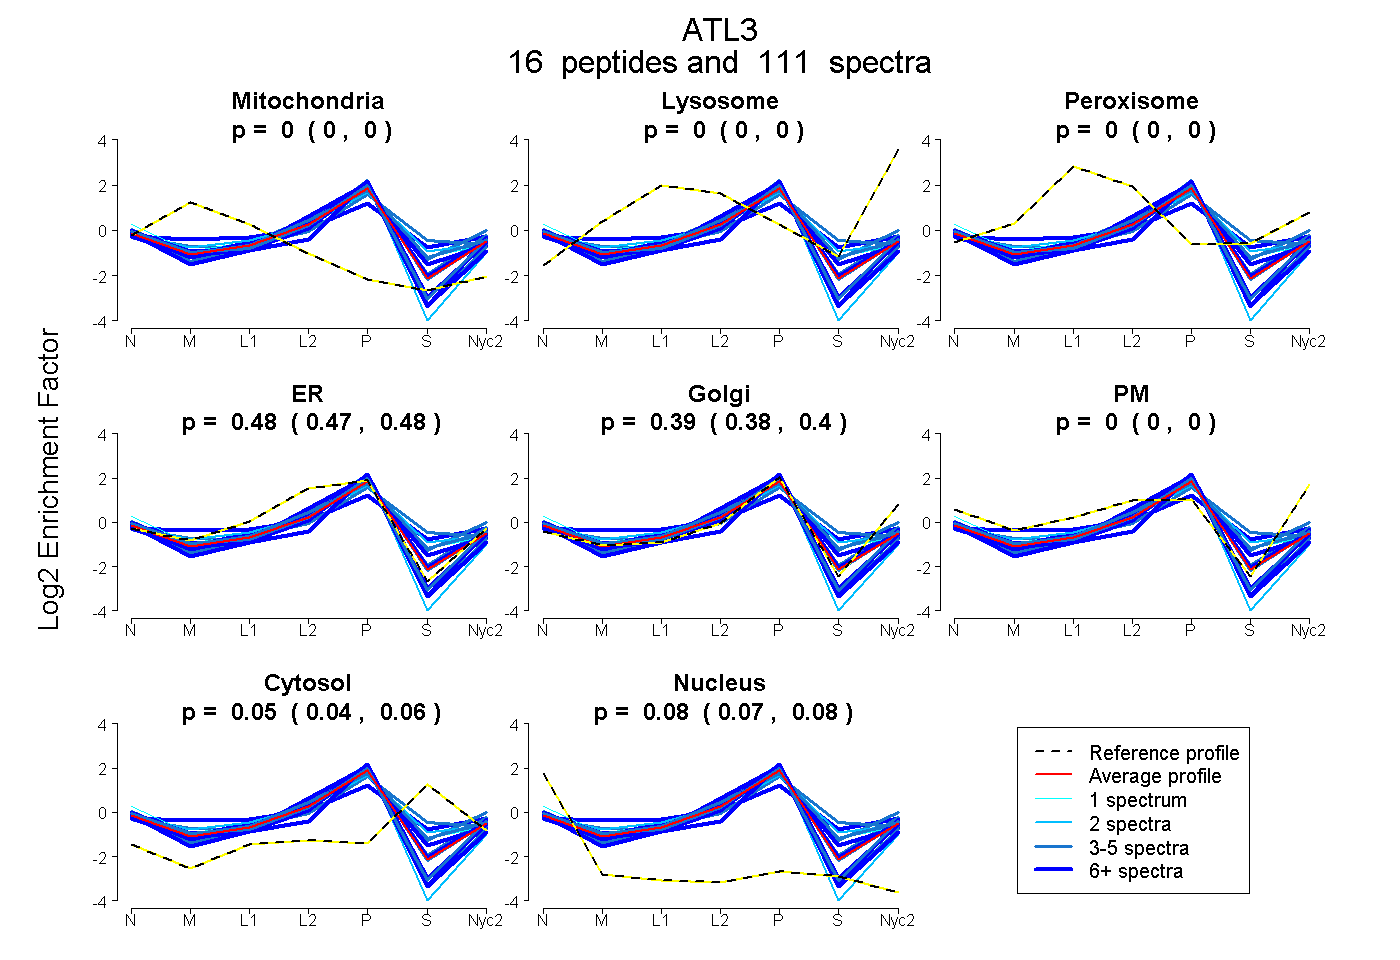 |
0.000
0.000 | 0.000 |
0.000
0.000 | 0.000 |
|
0.000
0.000 | 0.000 |
0.477
0.471 | 0.481 |
0.392
0.385 | 0.398 |
0.000
0.000 | 0.000 |
0.052
0.044 | 0.060 |
0.079
0.074 | 0.082 |
|
| | | Plot |
Mito |
|
Lyso or Perox |
|
ER |
Golgi |
PM |
Cytosol |
Nucleus |
|
| Expt B |
12
peptides |
61
spectra |
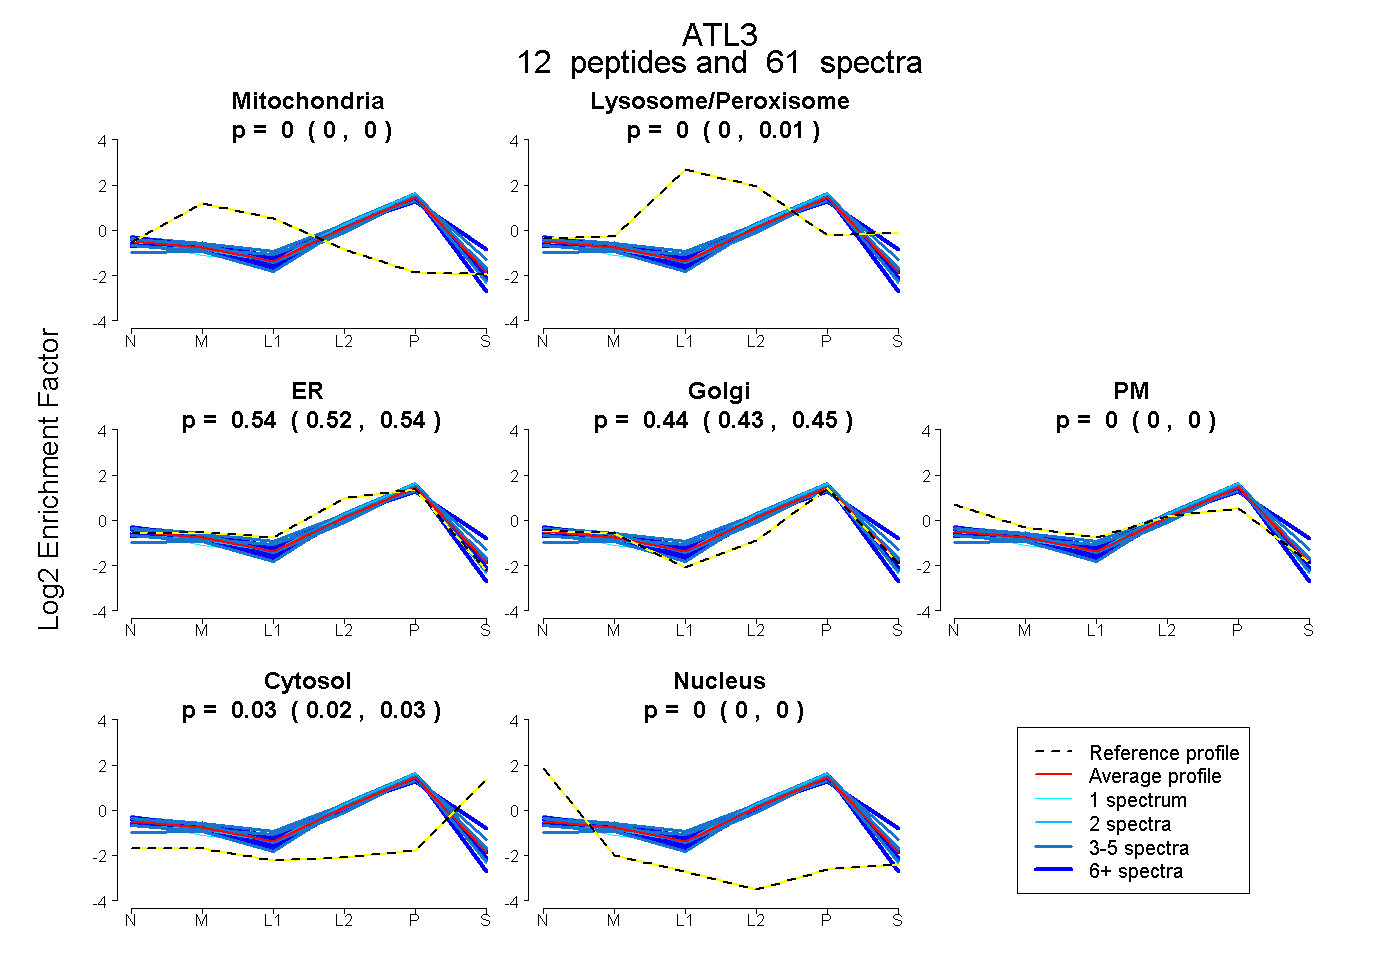 |
0.000
0.000 | 0.000 |
|
0.000
0.000 | 0.005 |
|
0.538
0.525 | 0.541 |
0.437
0.430 | 0.446 |
0.000
0.000 | 0.000 |
0.026
0.020 | 0.029 |
0.000
0.000 | 0.000 |
|
| 5 spectra, YLYSQK |
0.000 |
|
0.095 |
|
0.364 |
0.540 |
0.000 |
0.000 |
0.000 |
|
| 5 spectra, IYQGEDLPHPK |
0.000 |
|
0.131 |
|
0.363 |
0.452 |
0.054 |
0.000 |
0.000 |
|
| 4 spectra, DAIAGRPPADK |
0.000 |
|
0.000 |
|
0.490 |
0.487 |
0.000 |
0.000 |
0.023 |
|
| 3 spectra, EHQHEEIQNVR |
0.000 |
|
0.000 |
|
0.610 |
0.341 |
0.000 |
0.050 |
0.000 |
|
| 7 spectra, ALASVLLQDHIR |
0.000 |
|
0.147 |
|
0.314 |
0.425 |
0.000 |
0.113 |
0.000 |
|
| 7 spectra, NVFSTFR |
0.000 |
|
0.000 |
|
0.537 |
0.455 |
0.000 |
0.000 |
0.008 |
|
| 1 spectrum, DIASEFK |
0.000 |
|
0.000 |
|
0.581 |
0.316 |
0.000 |
0.103 |
0.000 |
|
| 8 spectra, GLLEYFK |
0.000 |
|
0.000 |
|
0.484 |
0.507 |
0.000 |
0.000 |
0.010 |
|
| 4 spectra, TAAVASR |
0.000 |
|
0.000 |
|
0.452 |
0.537 |
0.007 |
0.000 |
0.004 |
|
| 2 spectra, QLALDHFK |
0.000 |
|
0.000 |
|
0.594 |
0.406 |
0.000 |
0.000 |
0.000 |
|
| 5 spectra, SFILDFMLR |
0.000 |
|
0.000 |
|
0.458 |
0.436 |
0.000 |
0.106 |
0.000 |
|
| 10 spectra, EQHSFELEER |
0.000 |
|
0.010 |
|
0.506 |
0.450 |
0.000 |
0.034 |
0.000 |
|
| | | Plot |
|
Lyso |
|
|
|
|
|
|
|
Other |
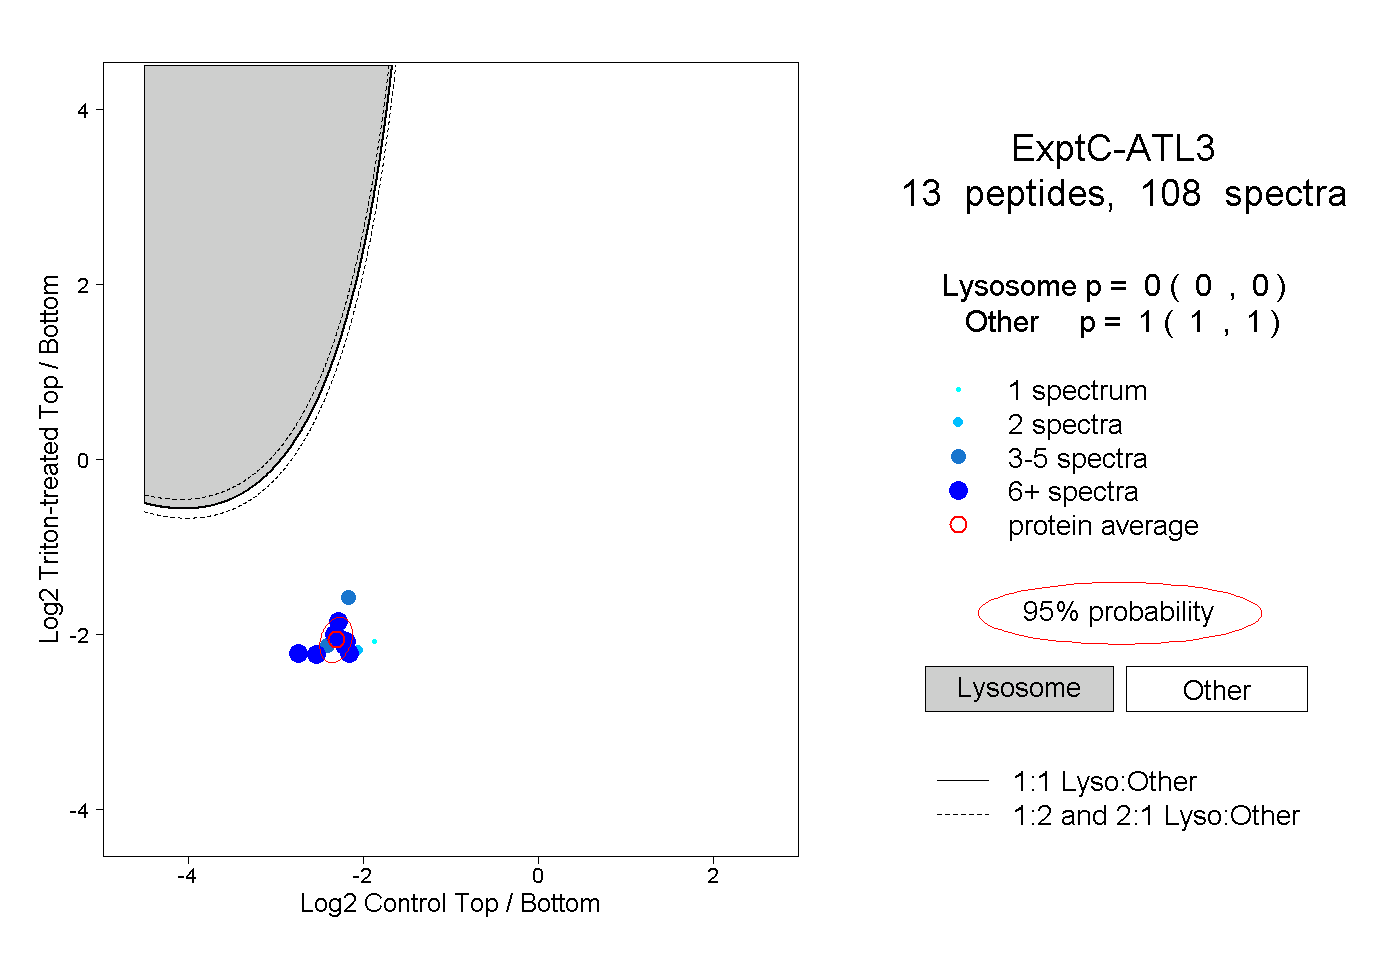
| Expt C |
13
peptides |
108
spectra |
 |
|
0.000
0.000 | 0.000 |
|
|
|
|
|
|
|
1.000
1.000 | 1.000 |
| | | Plot |
|
Lyso |
|
|
|
|
|
|
|
Other |
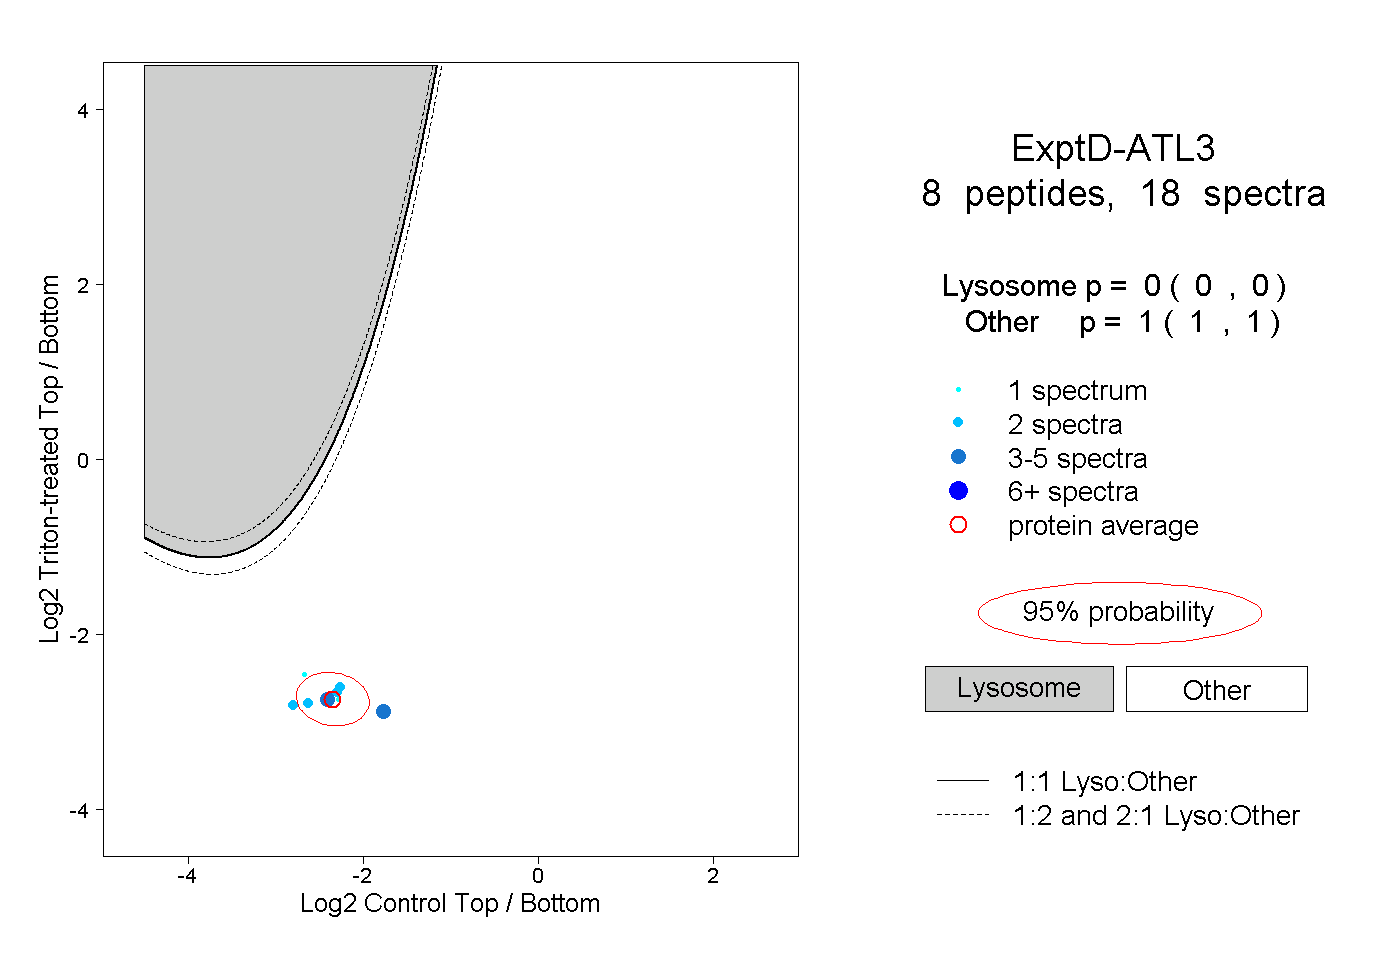
| Expt D |
8
peptides |
18
spectra |
 |
|
0.000
0.000 | 0.000 |
|
|
|
|
|
|
|
1.000
1.000 | 1.000 |