 16
16peptides
spectra
0.000 | 0.000
0.000 | 0.000
0.000 | 0.000
0.471 | 0.481
0.385 | 0.398
0.000 | 0.000
0.044 | 0.060
0.074 | 0.082
| Plot | Mito | Lyso | Perox | ER | Golgi | PM | Cytosol | Nucleus | |||||
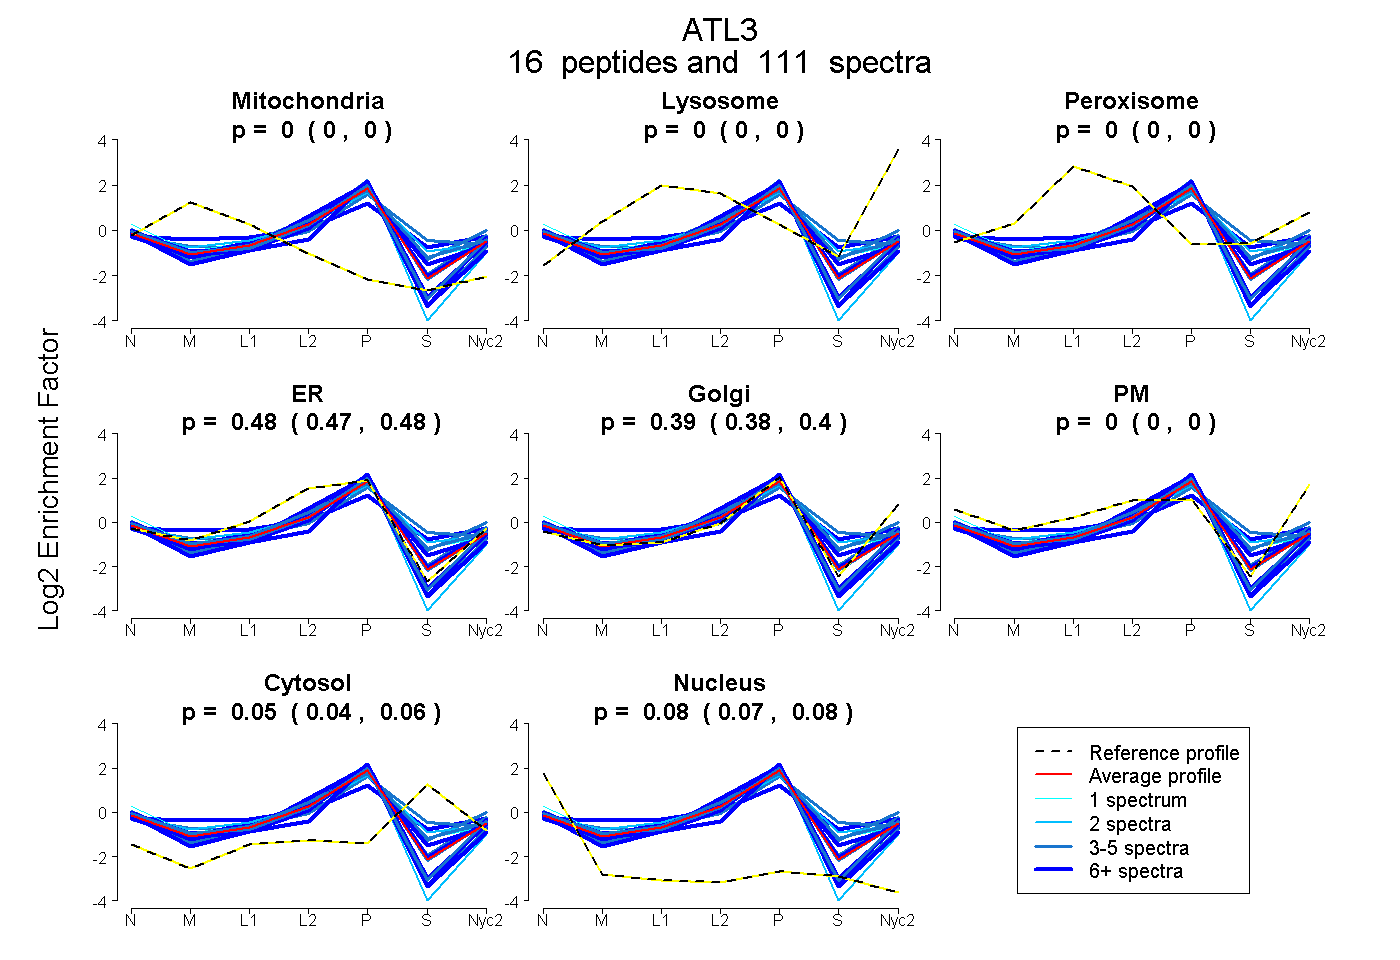
| Expt A |
16 peptides |
111 spectra |
|
0.000 0.000 | 0.000 |
0.000 0.000 | 0.000 |
0.000 0.000 | 0.000 |
0.477 0.471 | 0.481 |
0.392 0.385 | 0.398 |
0.000 0.000 | 0.000 |
0.052 0.044 | 0.060 |
0.079 0.074 | 0.082 |
| 5 spectra, YLYSQK | 0.000 | 0.000 | 0.000 | 0.469 | 0.434 | 0.000 | 0.000 | 0.097 | ||
| 5 spectra, EINGSK | 0.000 | 0.000 | 0.000 | 0.518 | 0.371 | 0.000 | 0.043 | 0.068 | ||
| 2 spectra, DAIAGRPPADK | 0.000 | 0.000 | 0.000 | 0.659 | 0.200 | 0.000 | 0.000 | 0.141 | ||
| 5 spectra, EHQHEEIQNVR | 0.000 | 0.000 | 0.000 | 0.430 | 0.314 | 0.064 | 0.192 | 0.000 | ||
| 3 spectra, DIASEFK | 0.029 | 0.000 | 0.000 | 0.321 | 0.550 | 0.000 | 0.074 | 0.026 | ||
| 5 spectra, GLLEYFK | 0.000 | 0.000 | 0.000 | 0.542 | 0.338 | 0.000 | 0.000 | 0.120 | ||
| 5 spectra, QLALDHFK | 0.000 | 0.000 | 0.000 | 0.530 | 0.240 | 0.000 | 0.230 | 0.000 | ||
| 2 spectra, GGSDPETTGIQIWSEVFTVK | 0.000 | 0.000 | 0.002 | 0.552 | 0.183 | 0.000 | 0.264 | 0.000 | ||
| 10 spectra, IYQGEDLPHPK | 0.000 | 0.000 | 0.000 | 0.499 | 0.370 | 0.000 | 0.068 | 0.063 | ||
| 1 spectrum, EHGHSNWLGDPEEPLTGFSWR | 0.000 | 0.000 | 0.000 | 0.597 | 0.155 | 0.000 | 0.207 | 0.041 | ||
| 10 spectra, SFLLDFMLR | 0.000 | 0.000 | 0.000 | 0.420 | 0.479 | 0.000 | 0.000 | 0.101 | ||
| 14 spectra, ALASVLLQDHIR | 0.057 | 0.000 | 0.133 | 0.214 | 0.372 | 0.000 | 0.224 | 0.000 | ||
| 17 spectra, NVFSTFR | 0.000 | 0.000 | 0.000 | 0.573 | 0.355 | 0.000 | 0.000 | 0.071 | ||
| 7 spectra, TAAVASR | 0.000 | 0.000 | 0.000 | 0.356 | 0.478 | 0.000 | 0.000 | 0.167 | ||
| 3 spectra, EVAVVLMDTQGAFDSQSTVK | 0.000 | 0.000 | 0.000 | 0.395 | 0.250 | 0.000 | 0.356 | 0.000 | ||
| 17 spectra, EQHSFELEER | 0.000 | 0.000 | 0.000 | 0.585 | 0.207 | 0.000 | 0.164 | 0.044 |
| Plot | Mito | Lyso or Perox | ER | Golgi | PM | Cytosol | Nucleus | ||||||
| Expt B |
12 peptides |
61 spectra |
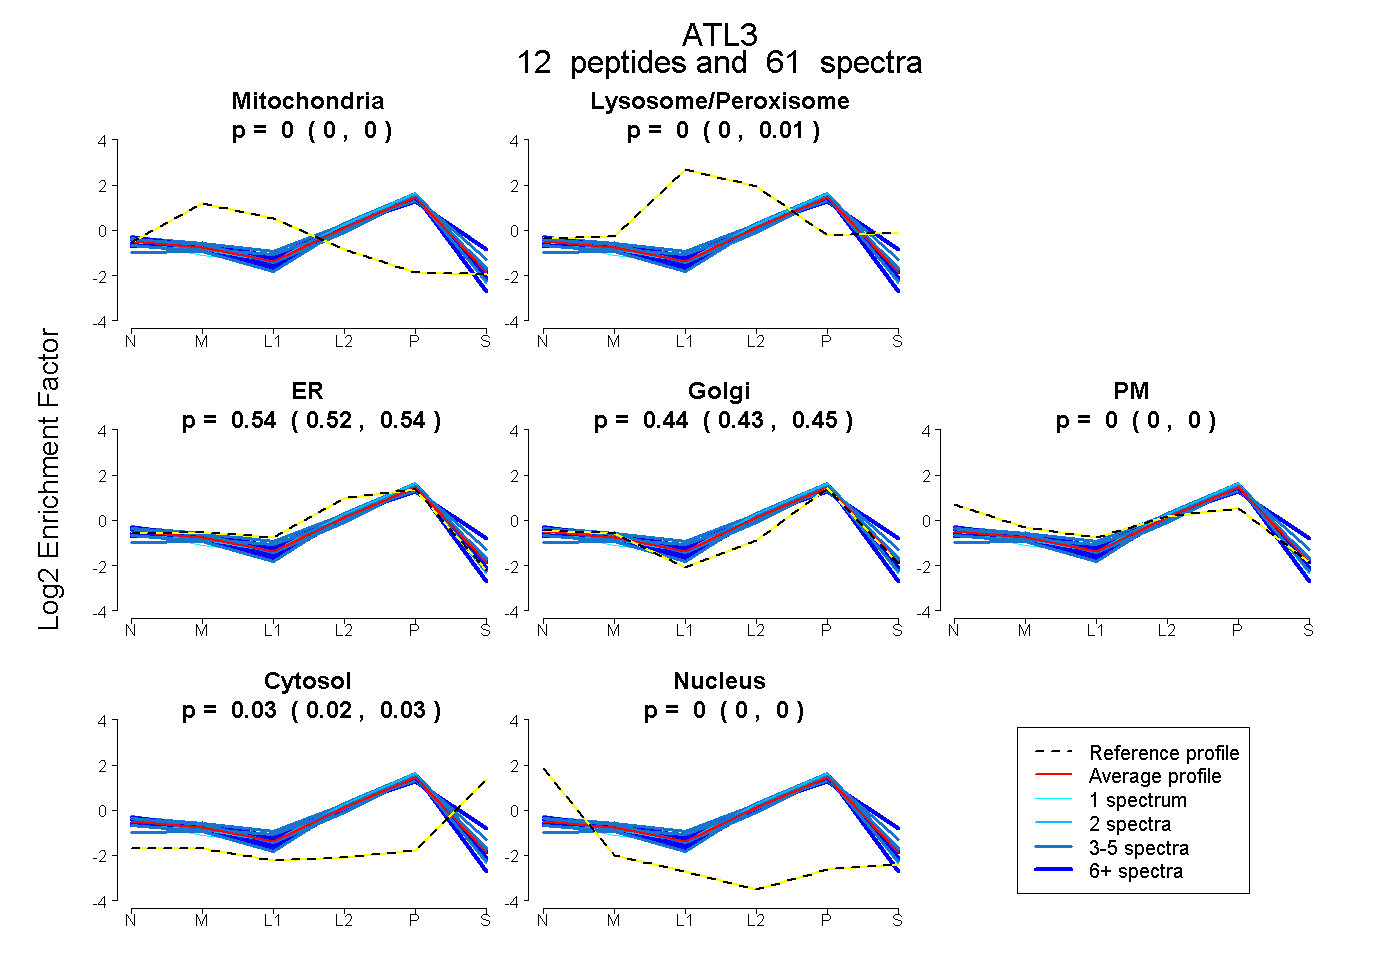 |
0.000 0.000 | 0.000 |
0.000 0.000 | 0.005 |
0.538 0.525 | 0.541 |
0.437 0.430 | 0.446 |
0.000 0.000 | 0.000 |
0.026 0.020 | 0.029 |
0.000 0.000 | 0.000 |
|||
| Plot | Lyso | Other | |||||||||||
| Expt C |
13 peptides |
108 spectra |
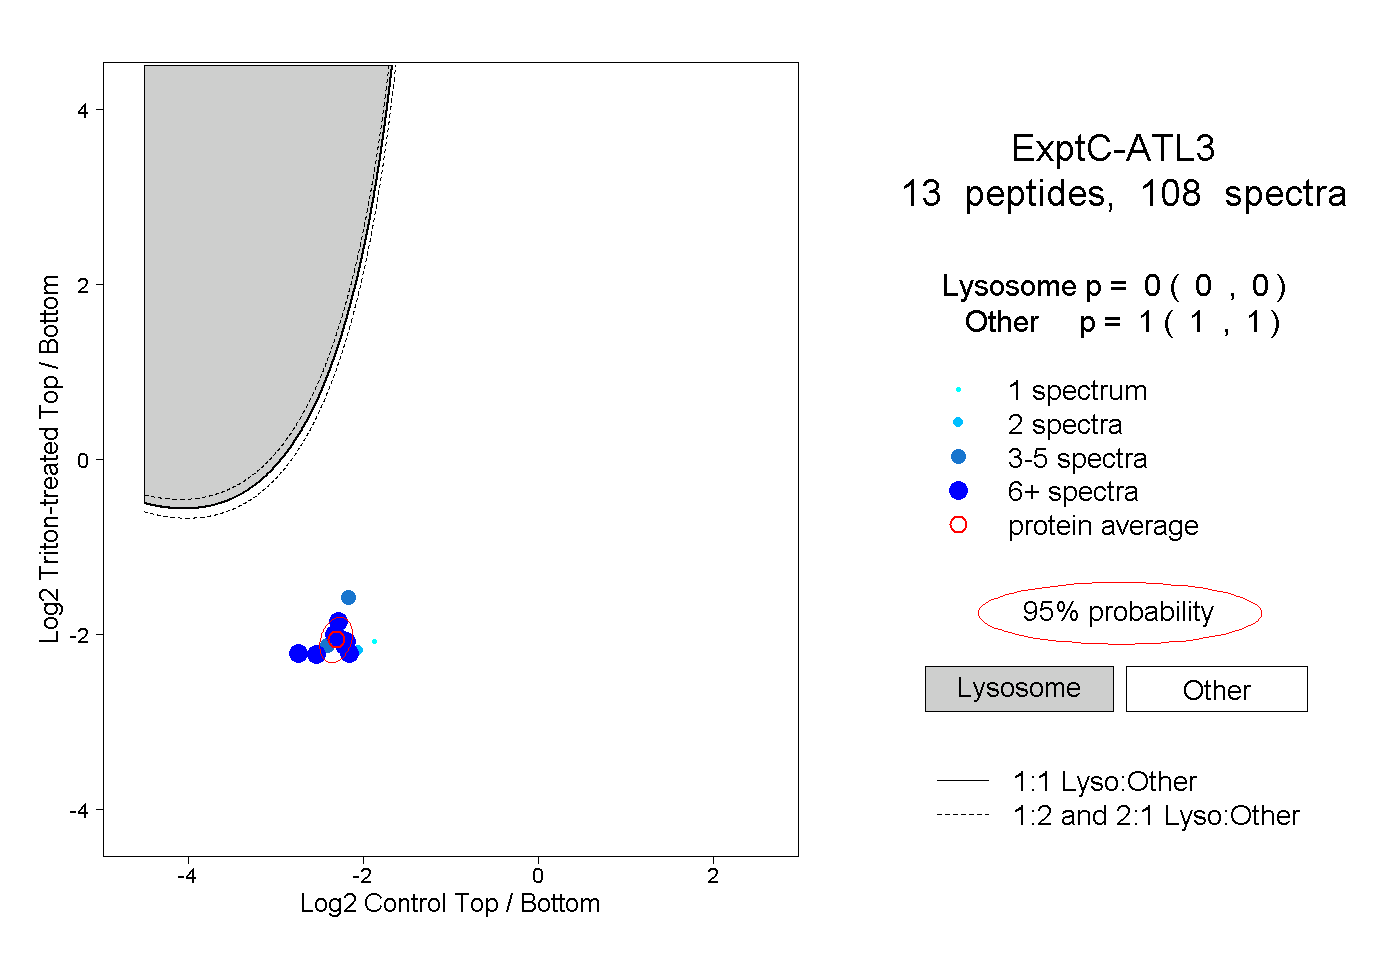 |
0.000 0.000 | 0.000 |
1.000 1.000 | 1.000 |
||||||||
| Plot | Lyso | Other | |||||||||||
| Expt D |
8 peptides |
18 spectra |
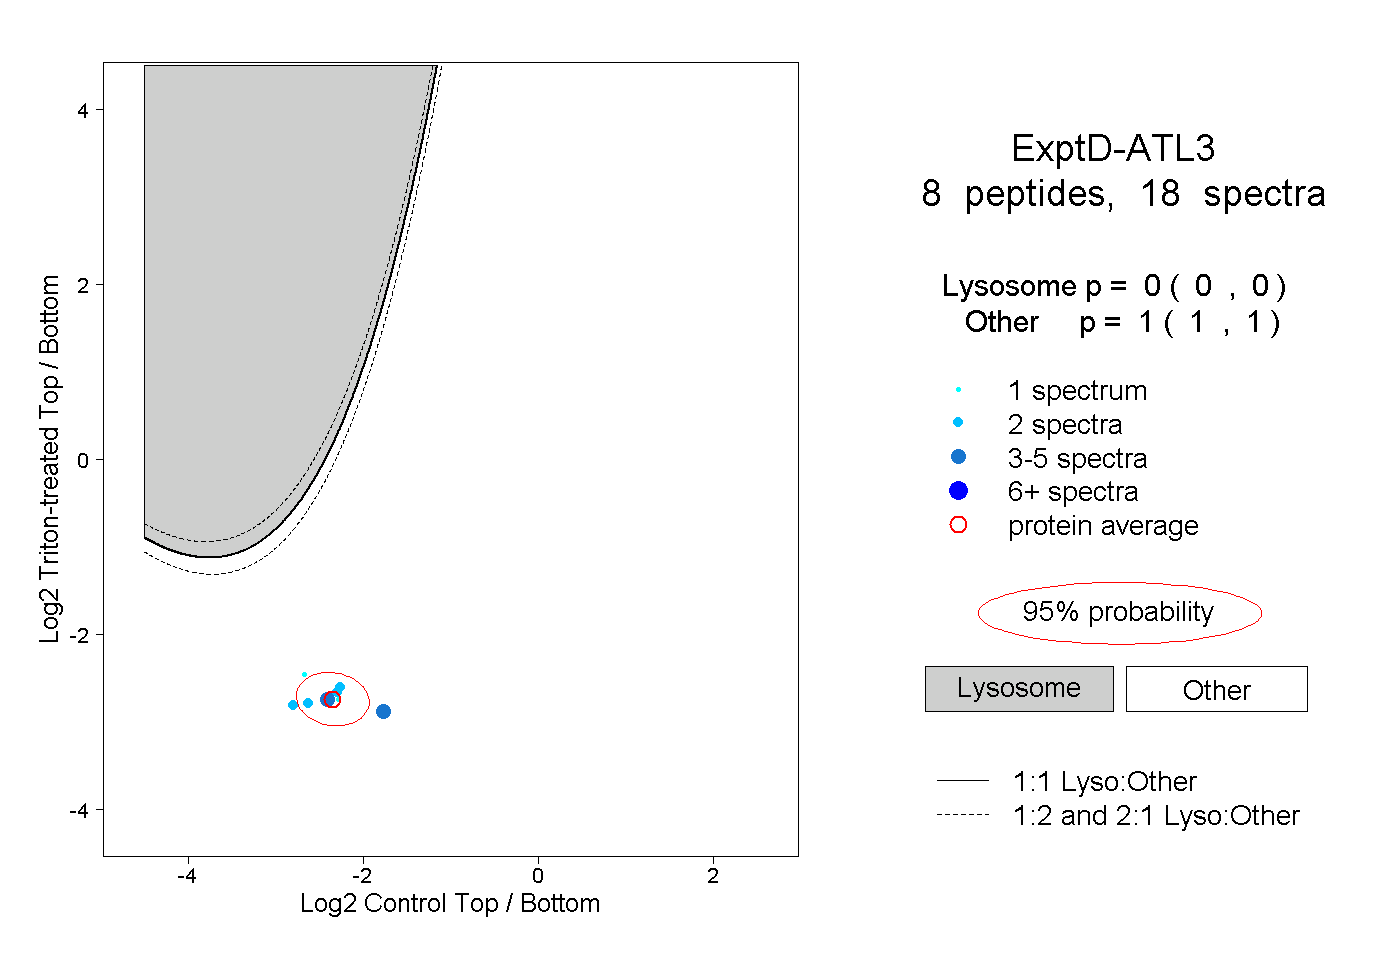 |
0.000 0.000 | 0.000 |
1.000 1.000 | 1.000 |