 4
4peptides
spectra
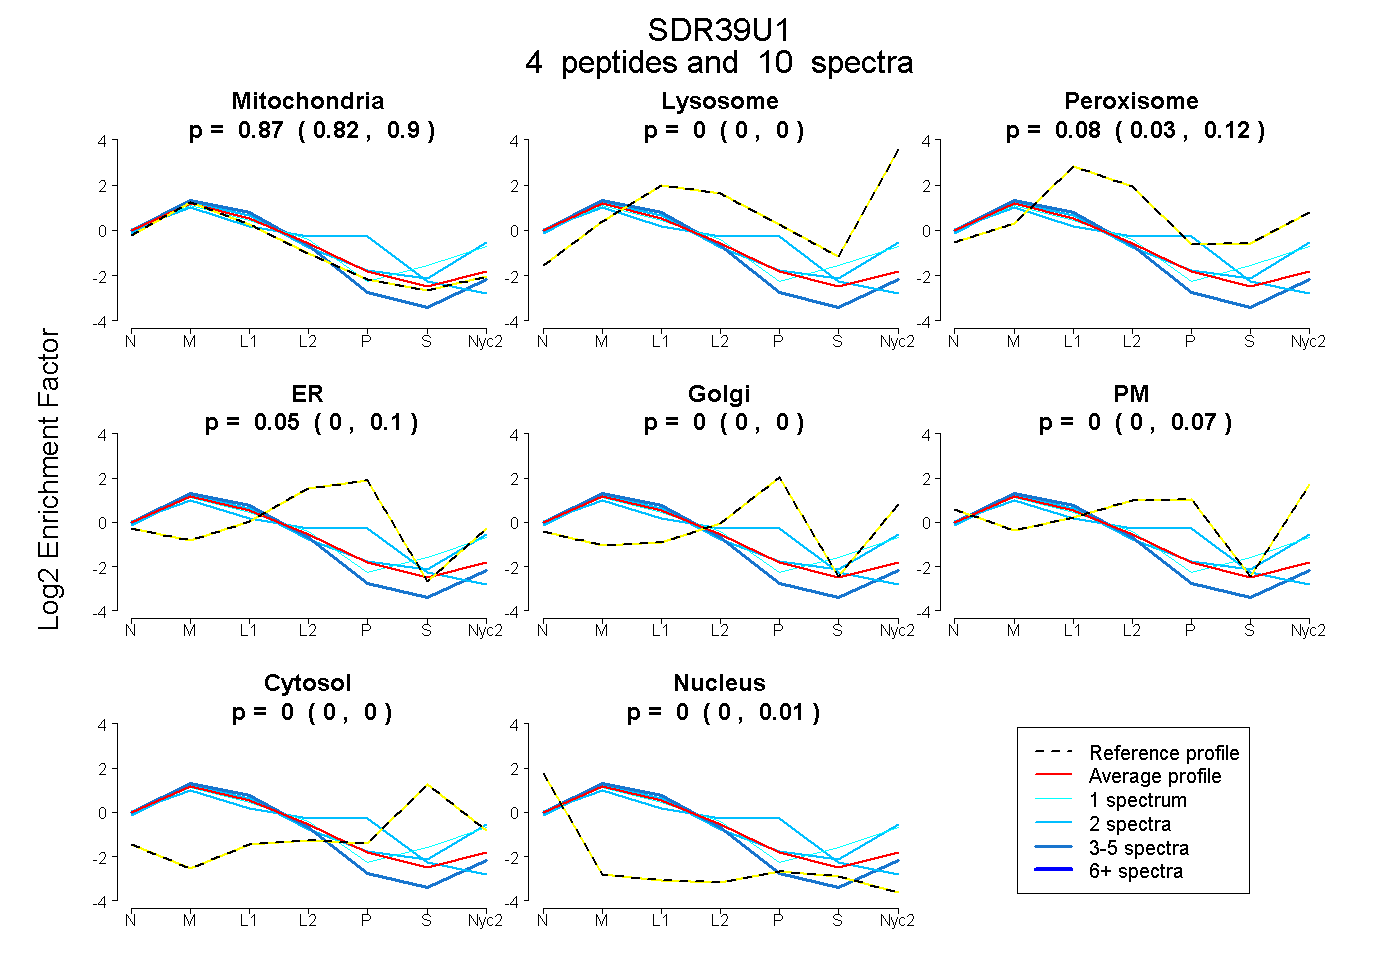
0.818 | 0.904
0.000 | 0.000
0.032 | 0.119
0.000 | 0.100
0.000 | 0.000
0.000 | 0.067
0.000 | 0.000
0.000 | 0.013
| Plot | Mito | Lyso | Perox | ER | Golgi | PM | Cytosol | Nucleus | |||||
| Expt A |
4 peptides |
10 spectra |
|
0.869 0.818 | 0.904 |
0.000 0.000 | 0.000 |
0.083 0.032 | 0.119 |
0.048 0.000 | 0.100 |
0.000 0.000 | 0.000 |
0.000 0.000 | 0.067 |
0.000 0.000 | 0.000 |
0.000 0.000 | 0.013 |
| 2 spectra, EVLTSR | 0.764 | 0.223 | 0.000 | 0.000 | 0.000 | 0.000 | 0.000 | 0.012 | ||
| 5 spectra, GGAIGHMLLPFR | 1.000 | 0.000 | 0.000 | 0.000 | 0.000 | 0.000 | 0.000 | 0.000 | ||
| 2 spectra, LDTTHLLAK | 0.687 | 0.000 | 0.000 | 0.291 | 0.000 | 0.000 | 0.000 | 0.022 | ||
| 1 spectrum, SGVVLGR | 0.704 | 0.085 | 0.140 | 0.000 | 0.000 | 0.000 | 0.070 | 0.000 |
| Plot | Mito | Lyso or Perox | ER | Golgi | PM | Cytosol | Nucleus | ||||||
| Expt B |
2 peptides |
4 spectra |
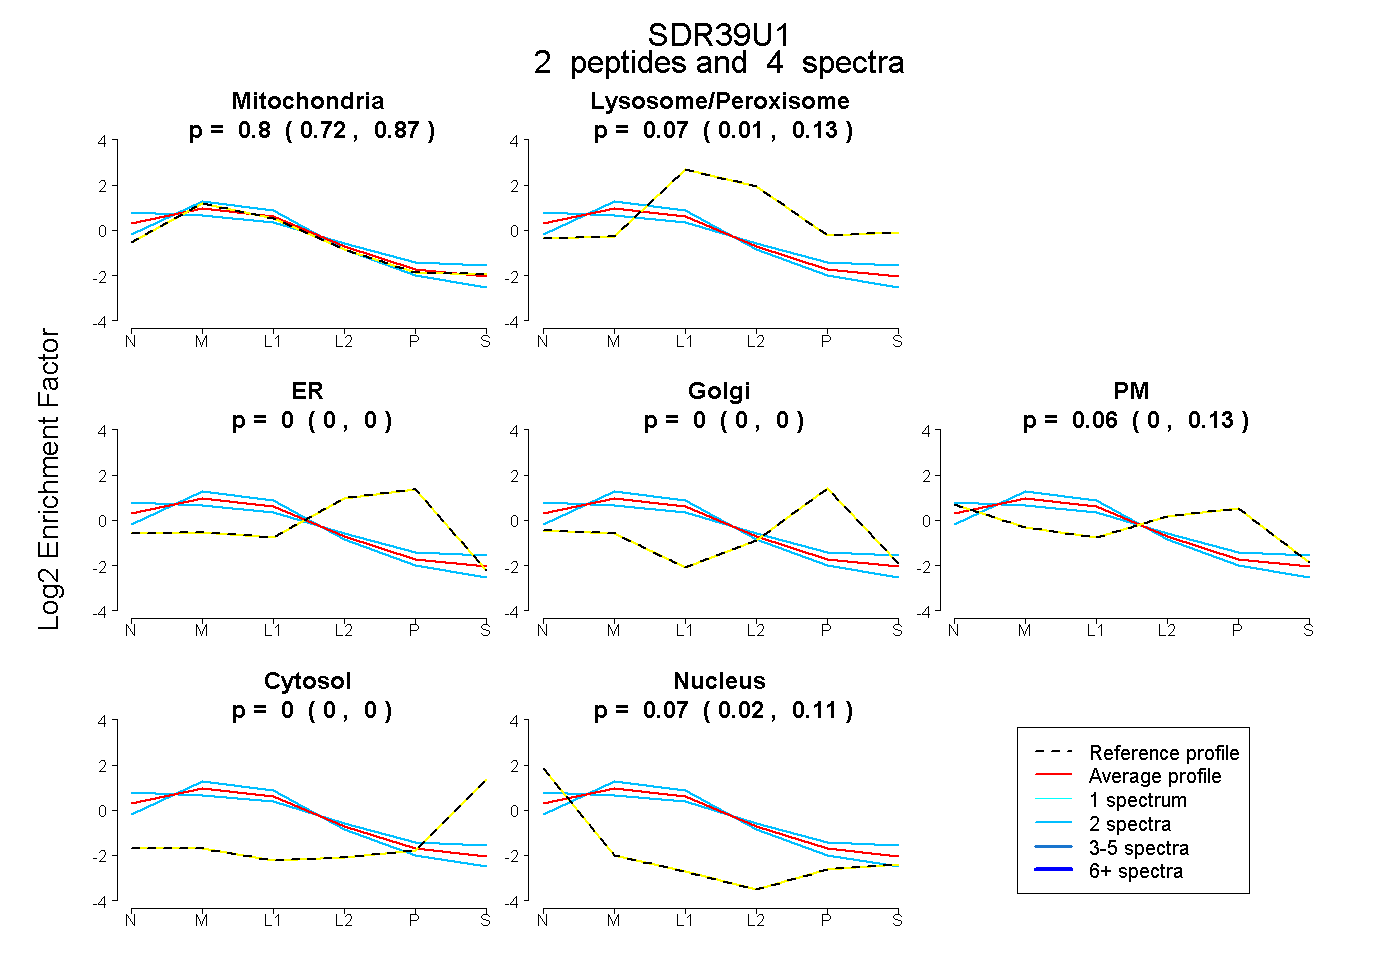 |
0.798 0.718 | 0.867 |
0.072 0.007 | 0.126 |
0.000 0.000 | 0.000 |
0.000 0.000 | 0.000 |
0.061 0.000 | 0.134 |
0.000 0.000 | 0.000 |
0.069 0.019 | 0.110 |
|||
| Plot | Lyso | Other | |||||||||||
| Expt C |
6 peptides |
19 spectra |
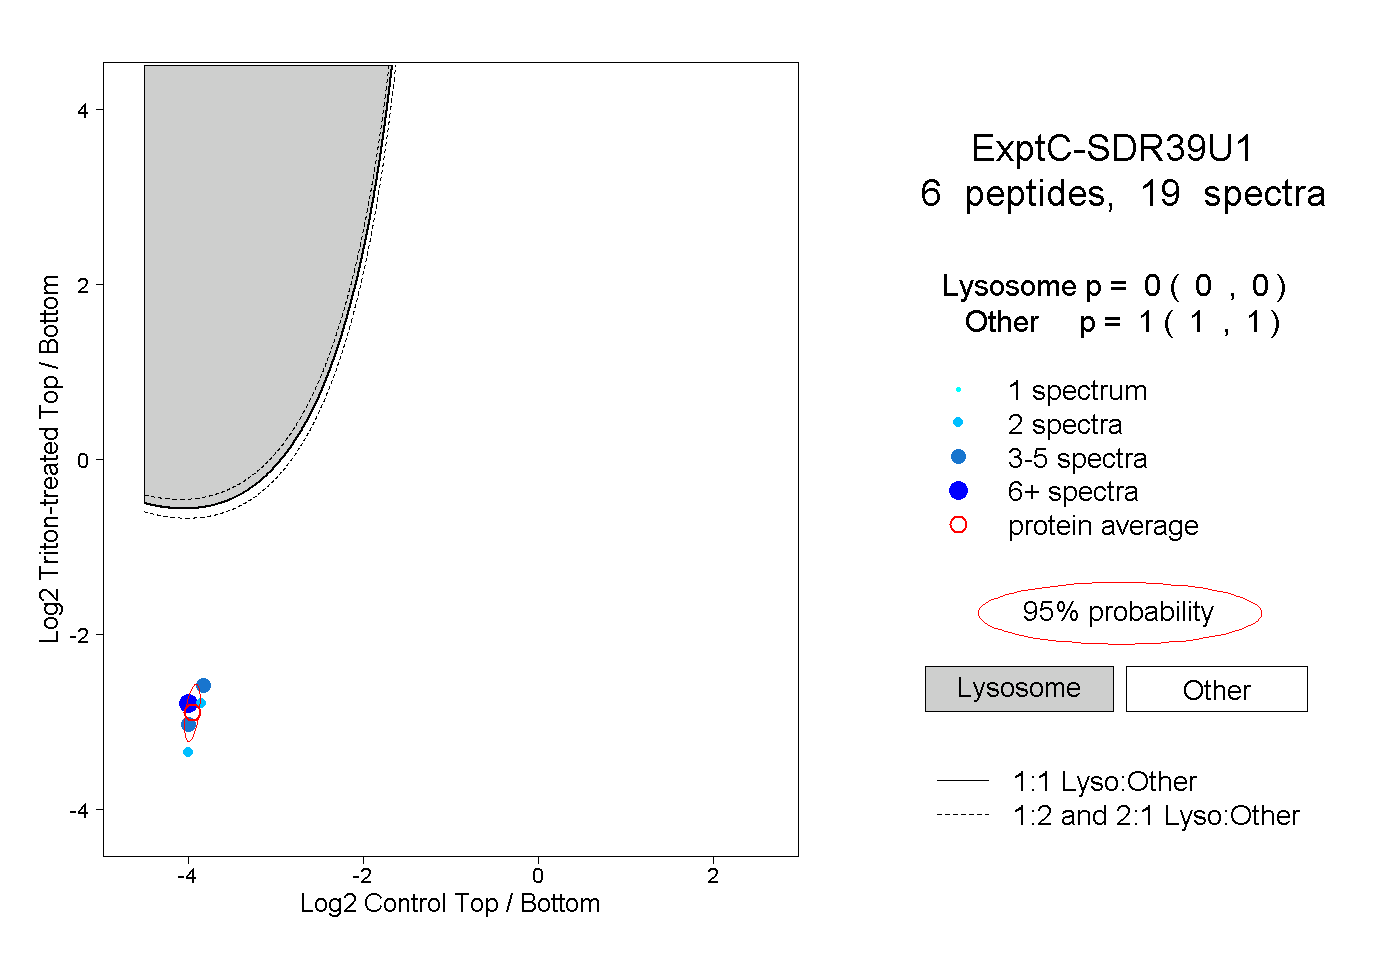 |
0.000 0.000 | 0.000 |
1.000 1.000 | 1.000 |
||||||||
| Plot | Lyso | Other | |||||||||||
| Expt D |
1 peptide |
1 spectrum |
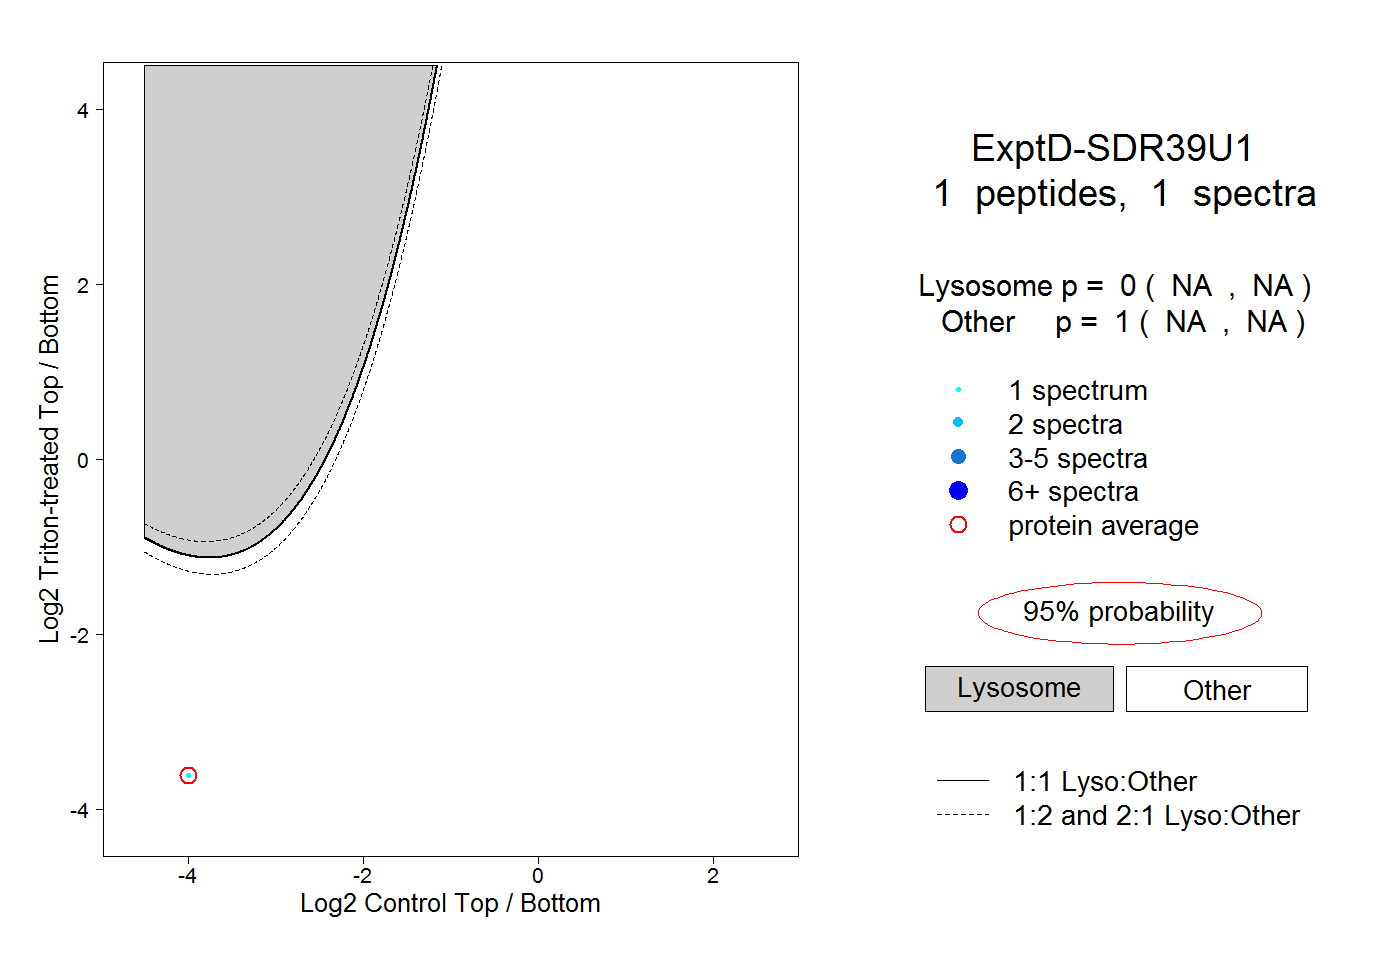 |
0.000 NA | NA |
1.000 NA | NA |