7
7peptides
spectra
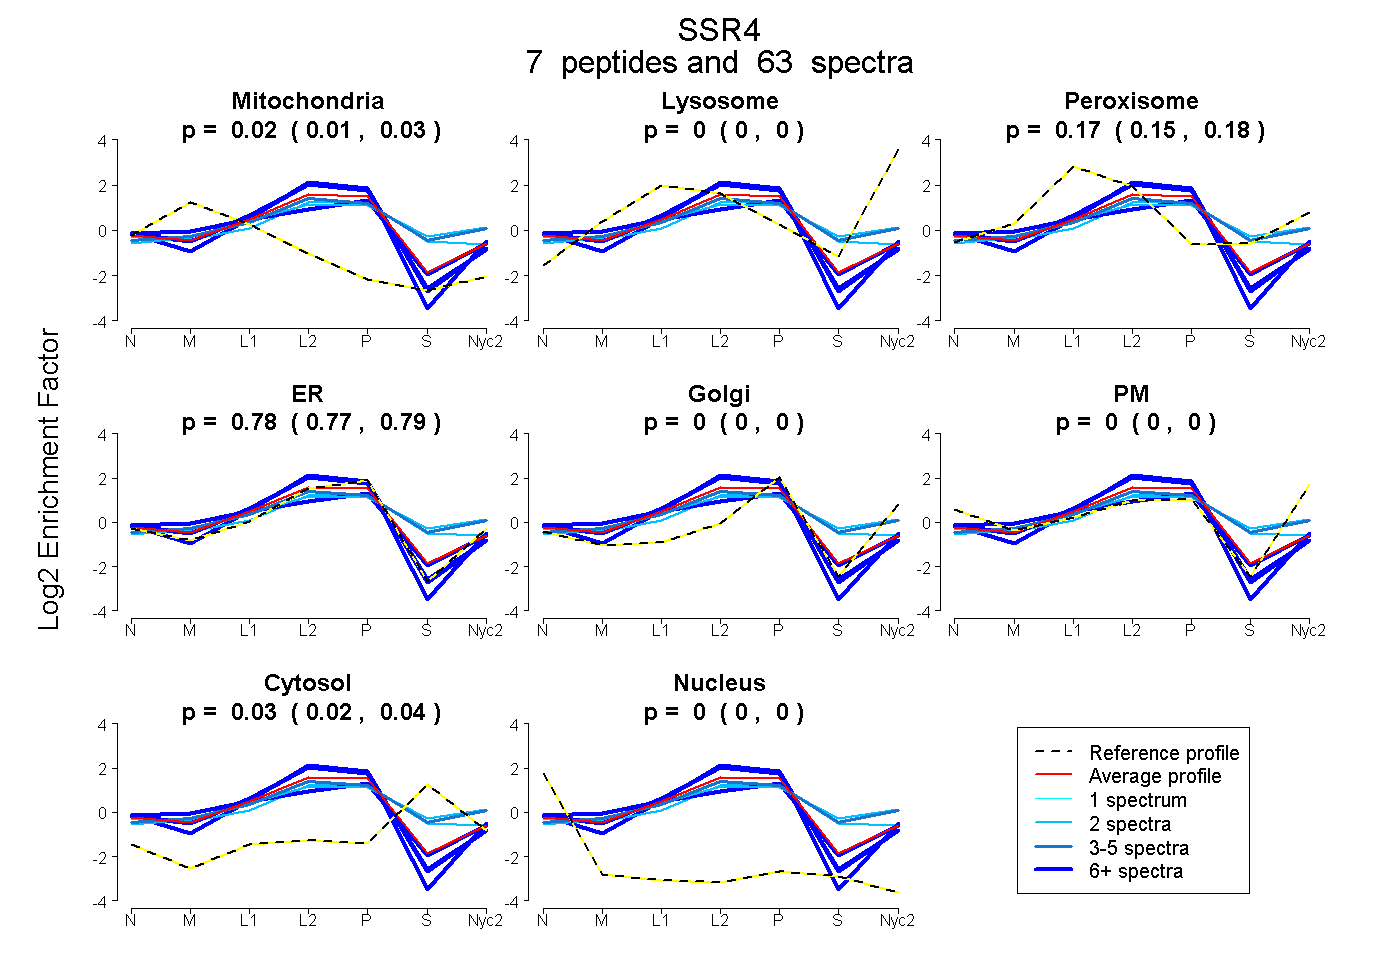
0.006 | 0.032
0.000 | 0.000
0.153 | 0.177
0.767 | 0.794
0.000 | 0.000
0.000 | 0.000
0.017 | 0.045
0.000 | 0.000
5peptides
spectra
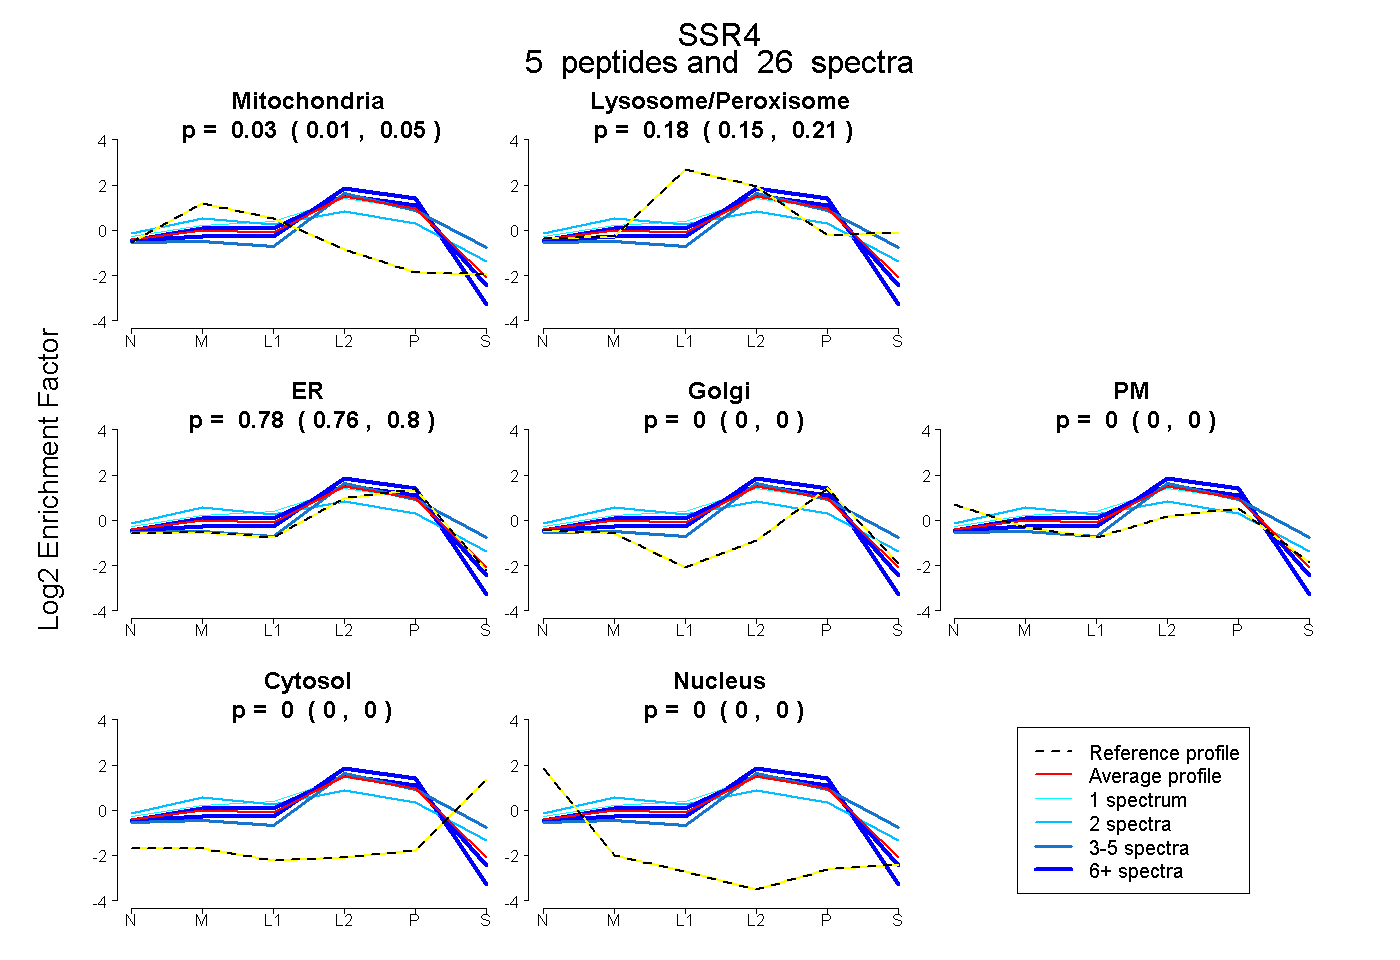
0.015 | 0.050
0.154 | 0.207
0.762 | 0.802
0.000 | 0.000
0.000 | 0.000
0.000 | 0.000
0.000 | 0.000