 7
7peptides
spectra
0.006 | 0.032
0.000 | 0.000
0.153 | 0.177
0.767 | 0.794
0.000 | 0.000
0.000 | 0.000
0.017 | 0.045
0.000 | 0.000
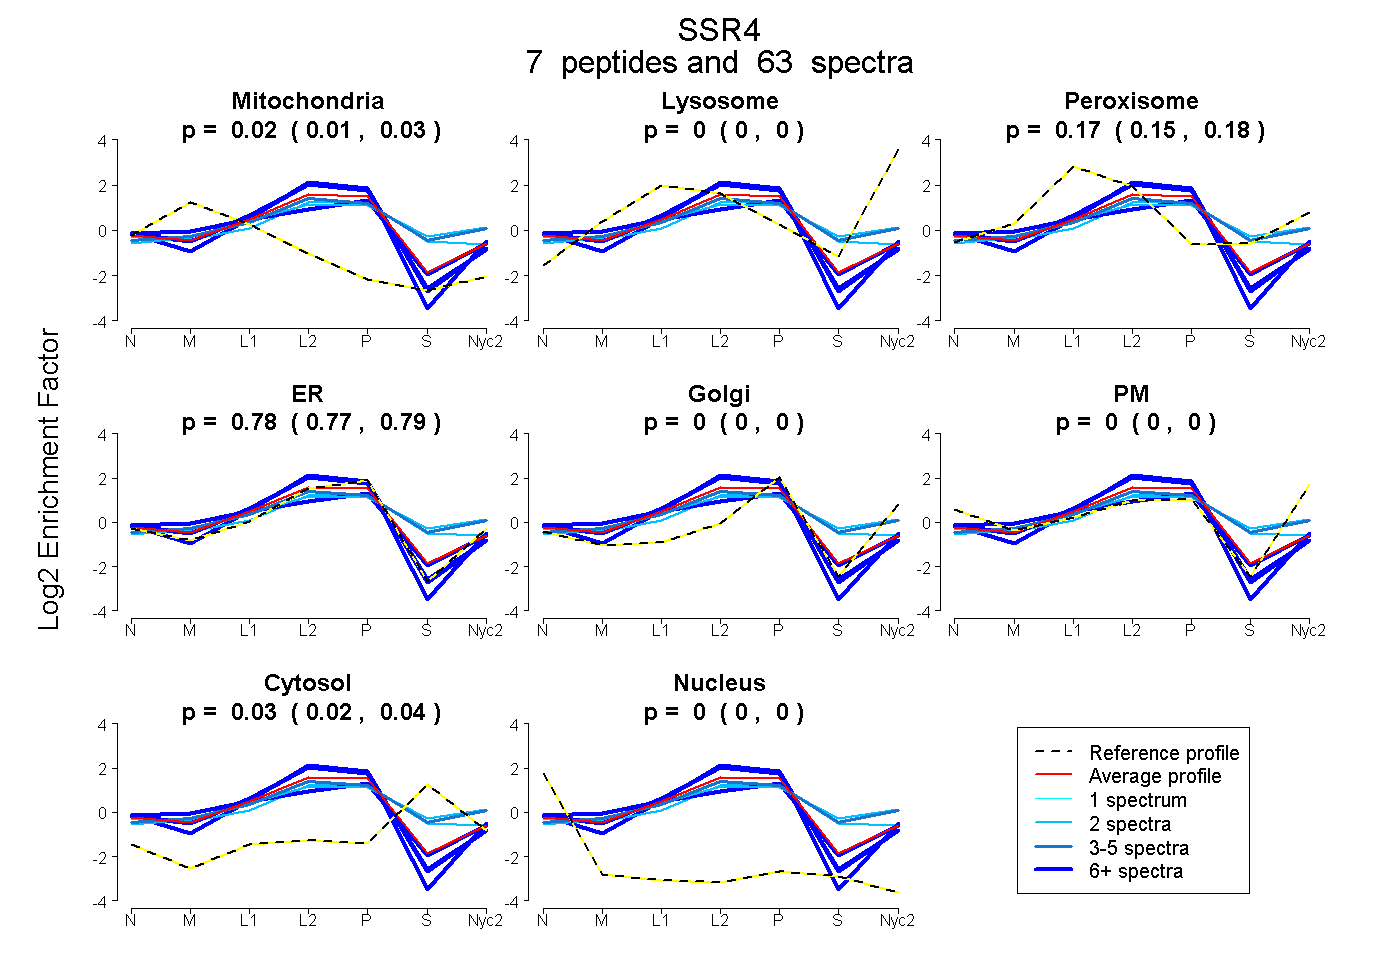
| Plot | Mito | Lyso | Perox | ER | Golgi | PM | Cytosol | Nucleus | |||||
| Expt A |
7 peptides |
63 spectra |
|
0.020 0.006 | 0.032 |
0.000 0.000 | 0.000 |
0.167 0.153 | 0.177 |
0.781 0.767 | 0.794 |
0.000 0.000 | 0.000 |
0.000 0.000 | 0.000 |
0.033 0.017 | 0.045 |
0.000 0.000 | 0.000 |
| 2 spectra, NNEDVSIIPPLFTVSVDHR | 0.000 | 0.000 | 0.201 | 0.574 | 0.000 | 0.000 | 0.225 | 0.000 | ||
| 4 spectra, YQVSWSLEHK | 0.000 | 0.057 | 0.268 | 0.499 | 0.000 | 0.000 | 0.177 | 0.000 | ||
| 2 spectra, VQNMALYADVSGK | 0.000 | 0.053 | 0.299 | 0.374 | 0.071 | 0.000 | 0.202 | 0.000 | ||
| 8 spectra, SAHAGTYEVR | 0.149 | 0.000 | 0.138 | 0.654 | 0.049 | 0.000 | 0.010 | 0.000 | ||
| 23 spectra, QFPVTR | 0.005 | 0.000 | 0.003 | 0.993 | 0.000 | 0.000 | 0.000 | 0.000 | ||
| 17 spectra, FFDEESYSLLR | 0.000 | 0.000 | 0.037 | 0.963 | 0.000 | 0.000 | 0.000 | 0.000 | ||
| 7 spectra, GQDVGR | 0.005 | 0.000 | 0.097 | 0.898 | 0.000 | 0.000 | 0.000 | 0.000 |
| Plot | Mito | Lyso or Perox | ER | Golgi | PM | Cytosol | Nucleus | ||||||
| Expt B |
5 peptides |
26 spectra |
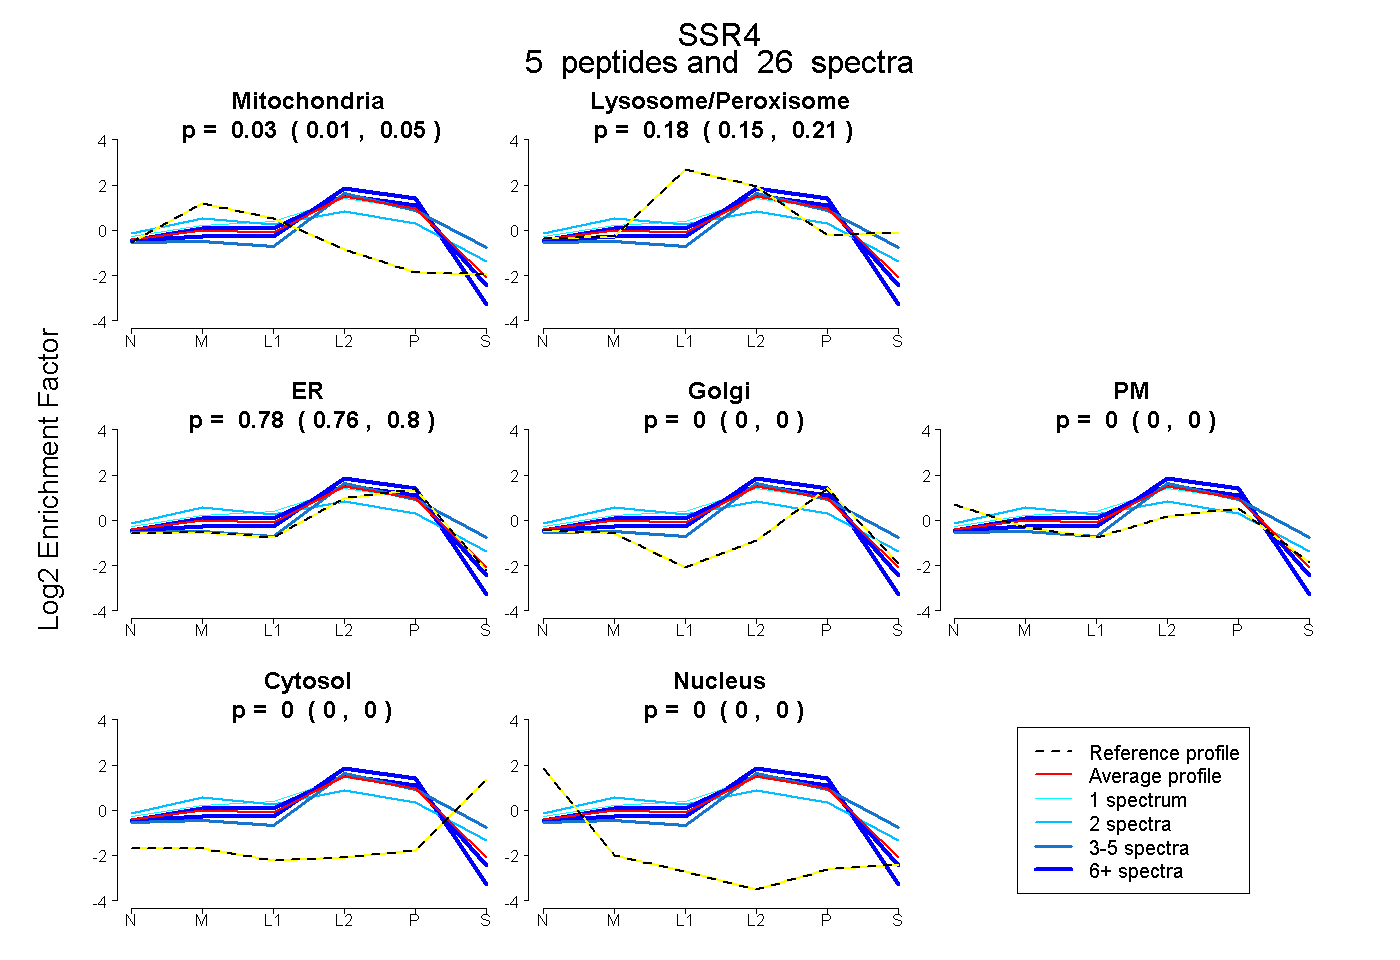 |
0.033 0.015 | 0.050 |
0.184 0.154 | 0.207 |
0.783 0.762 | 0.802 |
0.000 0.000 | 0.000 |
0.000 0.000 | 0.000 |
0.000 0.000 | 0.000 |
0.000 0.000 | 0.000 |
|||
| Plot | Lyso | Other | |||||||||||
| Expt C |
5 peptides |
82 spectra |
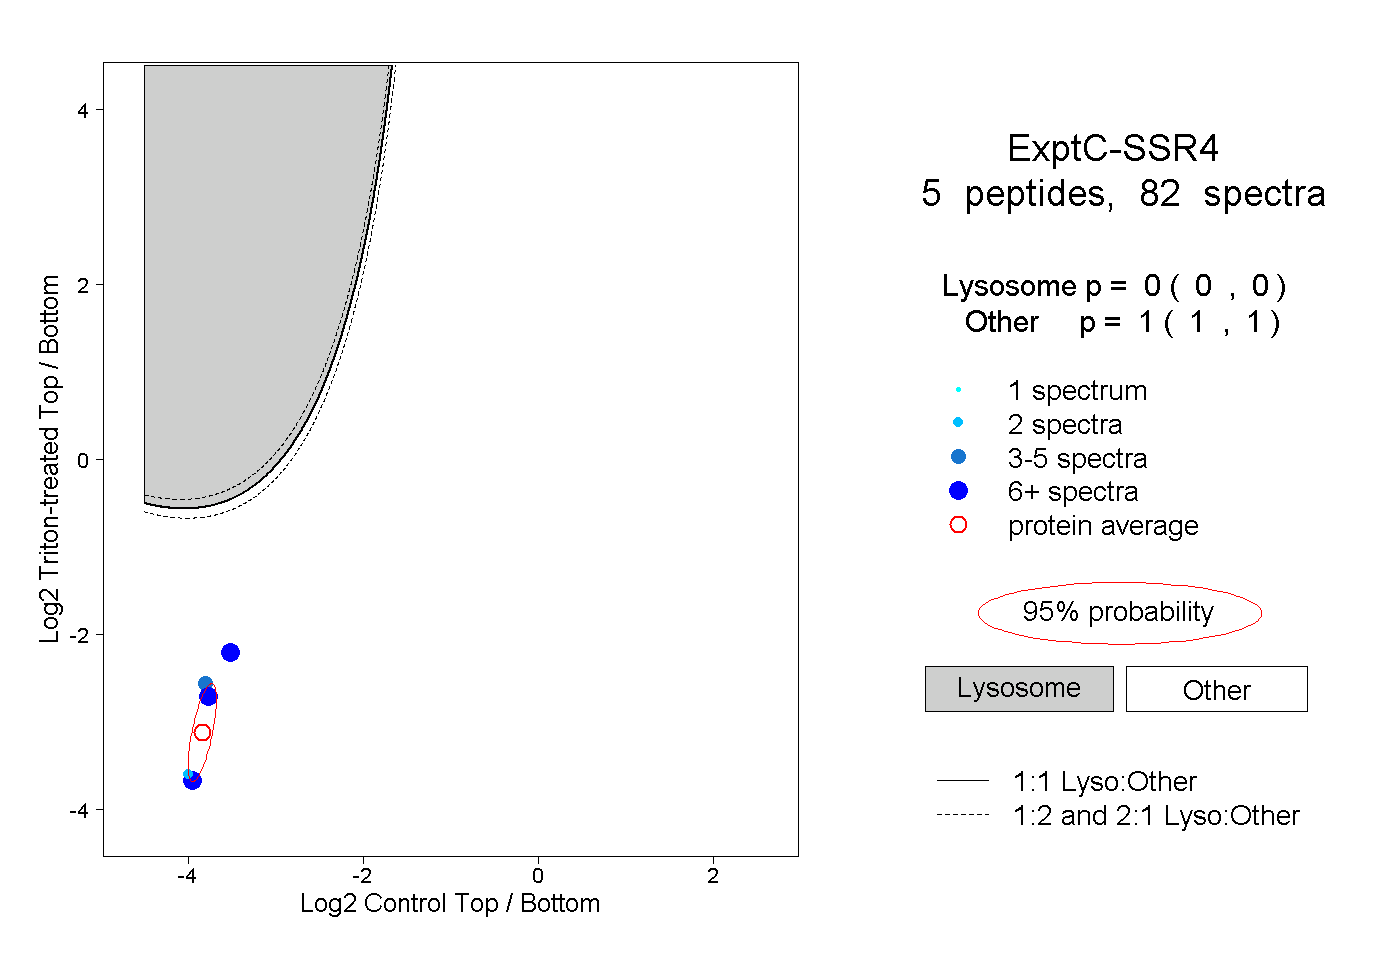 |
0.000 0.000 | 0.000 |
1.000 1.000 | 1.000 |
||||||||
| Plot | Lyso | Other | |||||||||||
| Expt D |
4 peptides |
15 spectra |
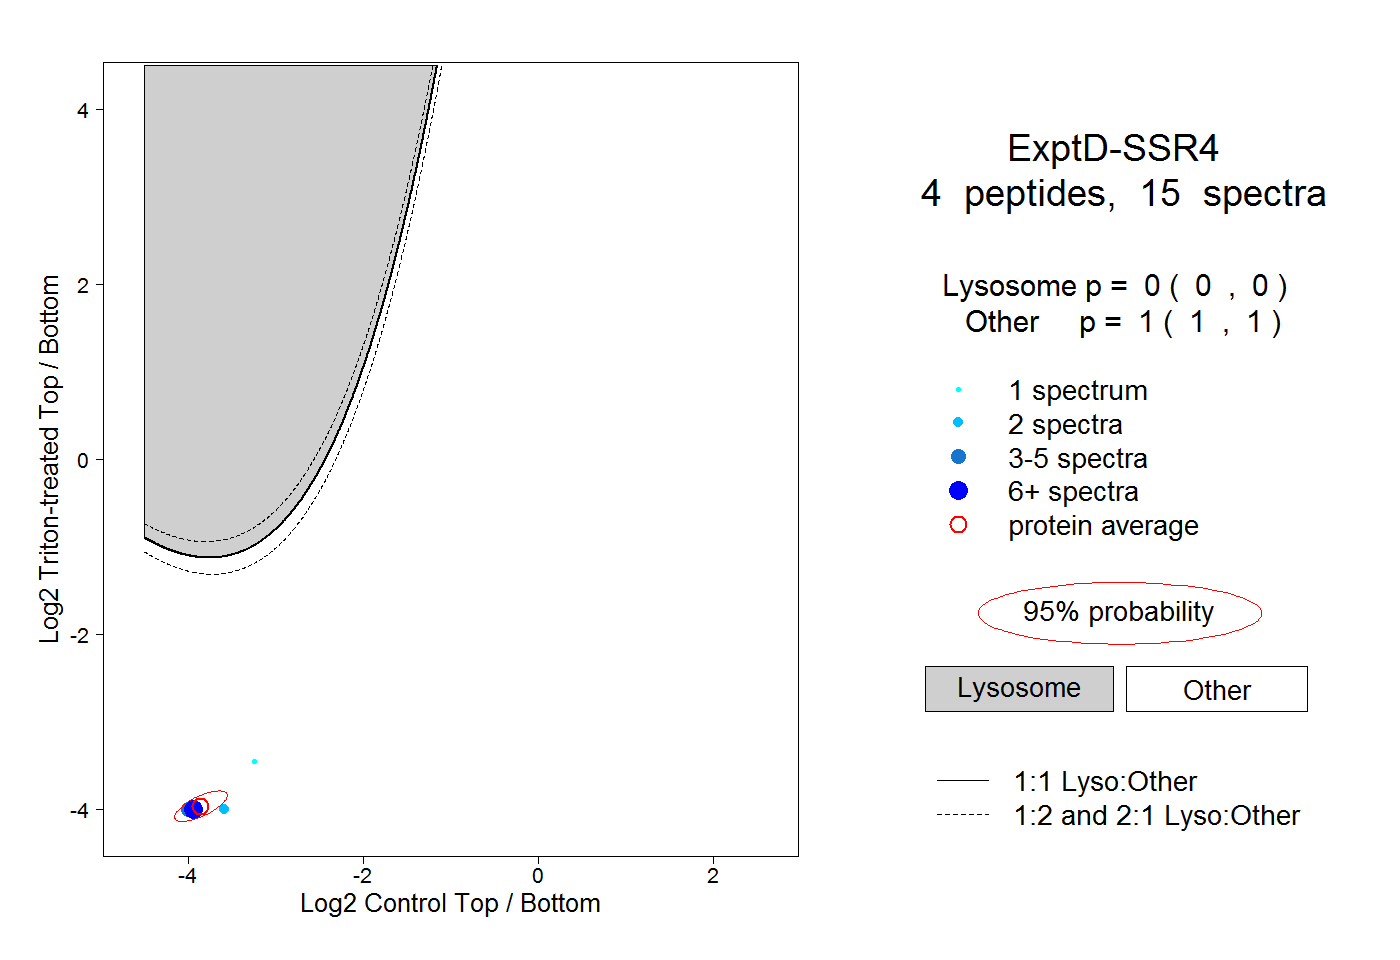 |
0.000 0.000 | 0.000 |
1.000 1.000 | 1.000 |