32
32peptides
spectra
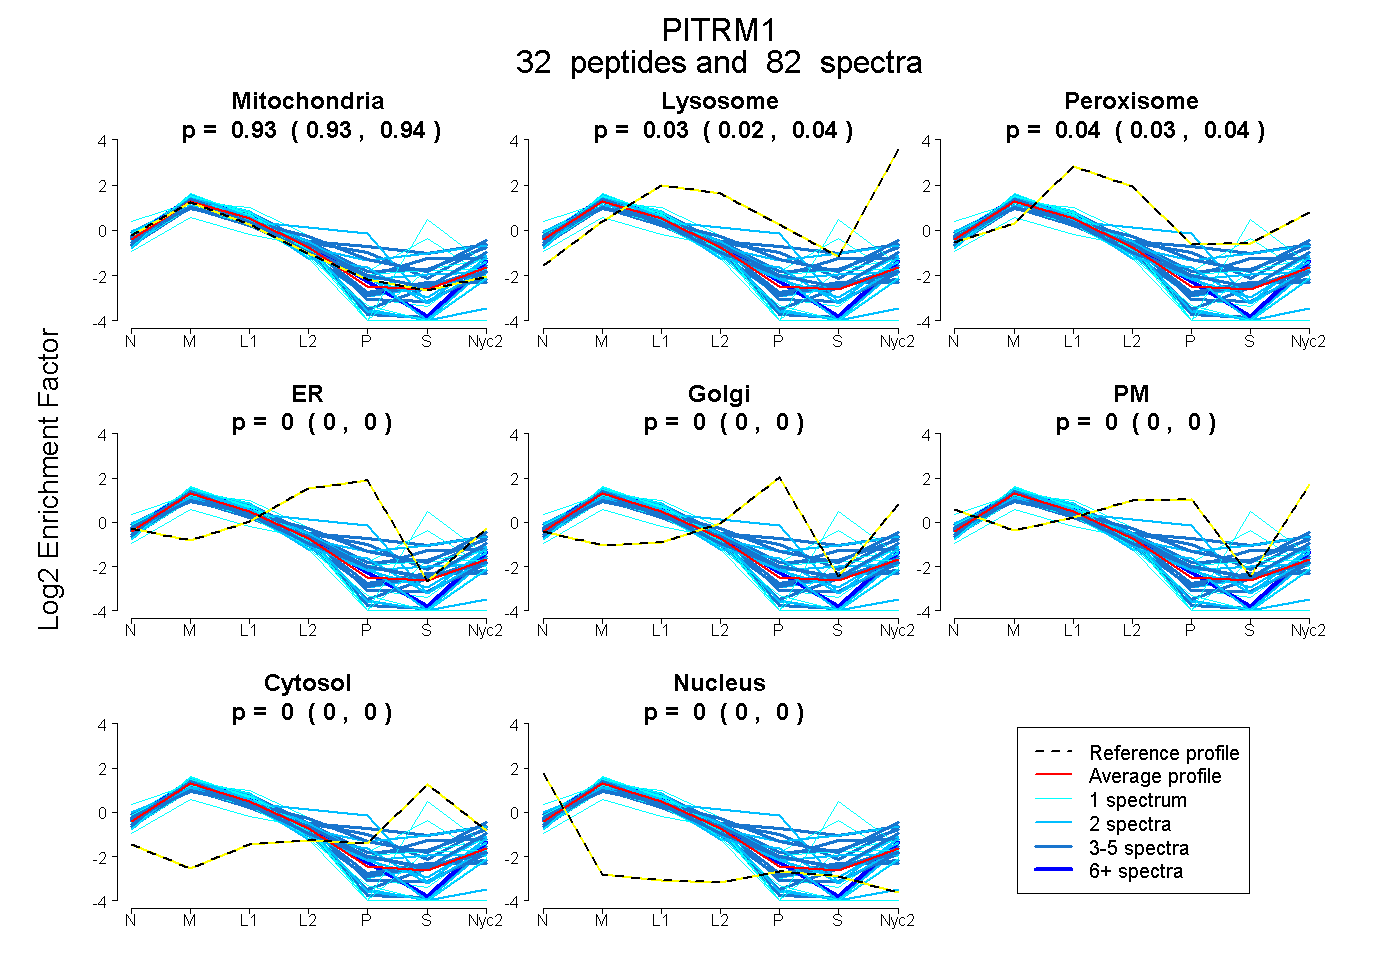
0.930 | 0.938
0.020 | 0.037
0.026 | 0.044
0.000 | 0.000
0.000 | 0.000
0.000 | 0.000
0.000 | 0.000
0.000 | 0.000
9peptides
spectra
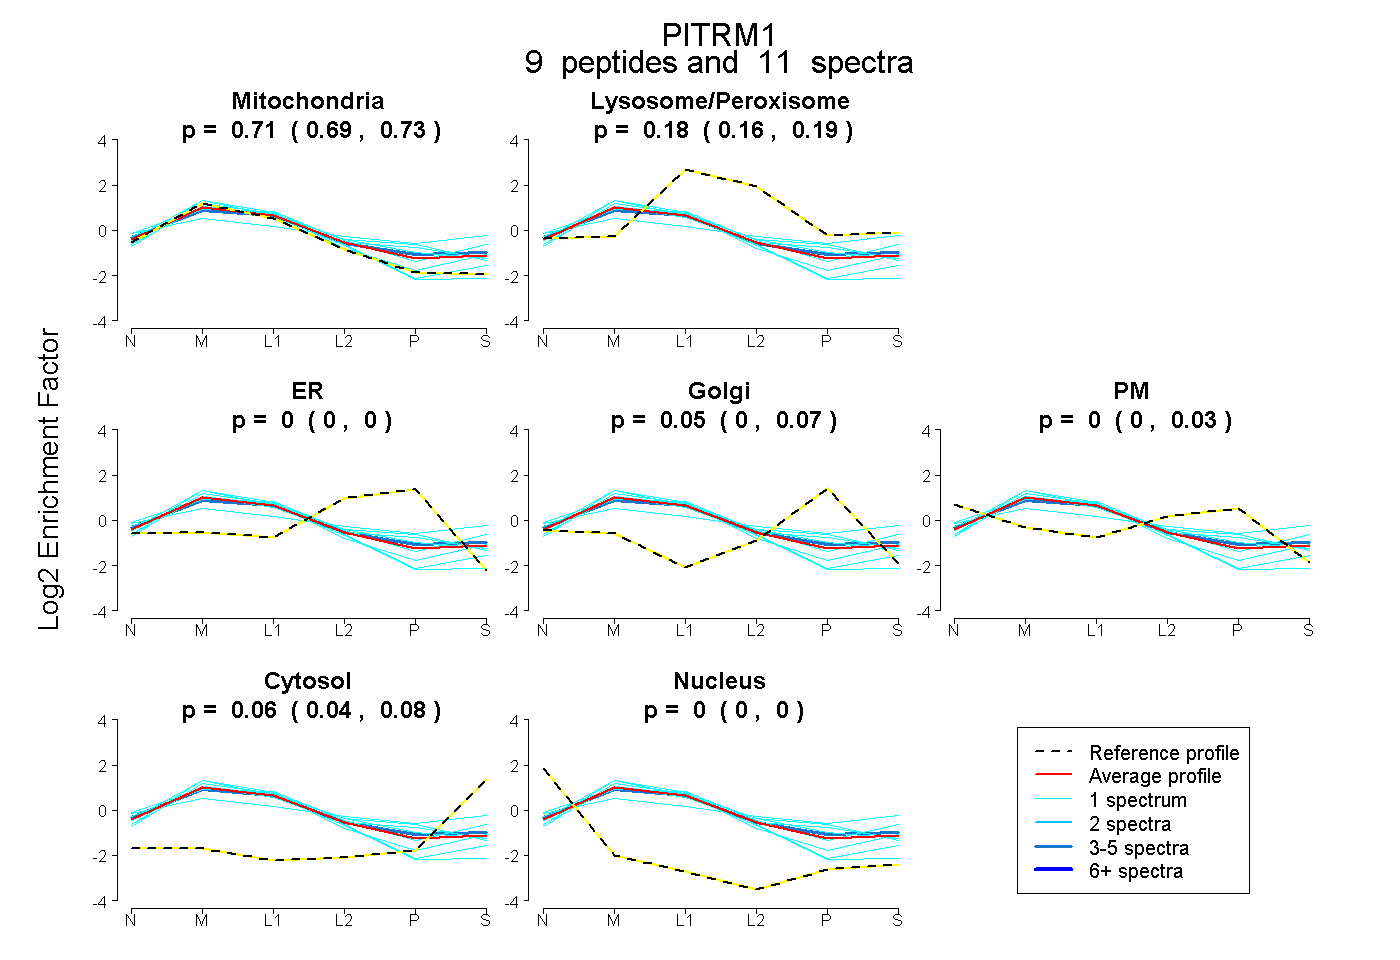
0.686 | 0.733
0.164 | 0.194
0.000 | 0.000
0.000 | 0.068
0.000 | 0.035
0.035 | 0.077
0.000 | 0.000