 32
32peptides
spectra
0.930 | 0.938
0.020 | 0.037
0.026 | 0.044
0.000 | 0.000
0.000 | 0.000
0.000 | 0.000
0.000 | 0.000
0.000 | 0.000
| Plot | Mito | Lyso | Perox | ER | Golgi | PM | Cytosol | Nucleus | |||||
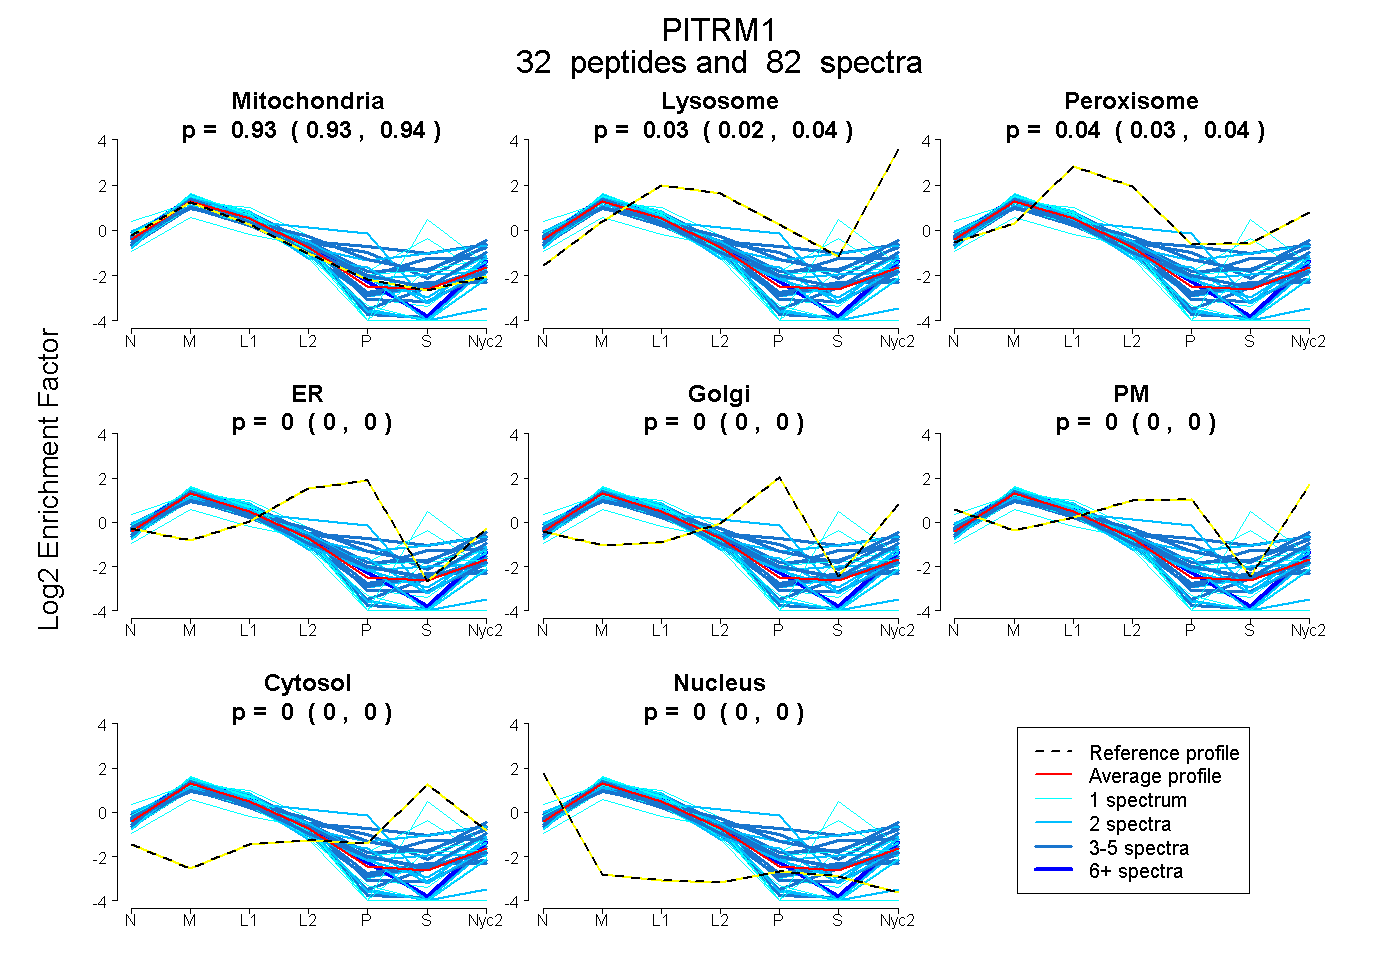
| Expt A |
32 peptides |
82 spectra |
|
0.935 0.930 | 0.938 |
0.029 0.020 | 0.037 |
0.036 0.026 | 0.044 |
0.000 0.000 | 0.000 |
0.000 0.000 | 0.000 |
0.000 0.000 | 0.000 |
0.000 0.000 | 0.000 |
0.000 0.000 | 0.000 |
| 1 spectrum, YLHLAR | 1.000 | 0.000 | 0.000 | 0.000 | 0.000 | 0.000 | 0.000 | 0.000 | ||
| 2 spectra, FFTYGNFPLEDHLK | 1.000 | 0.000 | 0.000 | 0.000 | 0.000 | 0.000 | 0.000 | 0.000 | ||
| 3 spectra, YWDKPR | 0.844 | 0.156 | 0.000 | 0.000 | 0.000 | 0.000 | 0.000 | 0.000 | ||
| 2 spectra, GVVFNEMK | 0.906 | 0.094 | 0.000 | 0.000 | 0.000 | 0.000 | 0.000 | 0.000 | ||
| 1 spectrum, TTPMDSTGVPHVLEHTVLCGSQK | 0.961 | 0.000 | 0.000 | 0.000 | 0.000 | 0.000 | 0.000 | 0.039 | ||
| 3 spectra, FTQQDIDEAK | 0.990 | 0.000 | 0.000 | 0.000 | 0.000 | 0.000 | 0.010 | 0.000 | ||
| 3 spectra, LTLSMKPDDR | 0.733 | 0.194 | 0.000 | 0.000 | 0.000 | 0.000 | 0.072 | 0.000 | ||
| 2 spectra, THFVLPFPVNYVGECVR | 0.949 | 0.000 | 0.000 | 0.051 | 0.000 | 0.000 | 0.000 | 0.000 | ||
| 4 spectra, GAFTDNER | 0.497 | 0.055 | 0.205 | 0.000 | 0.124 | 0.000 | 0.119 | 0.000 | ||
| 1 spectrum, AIDWAK | 0.984 | 0.016 | 0.000 | 0.000 | 0.000 | 0.000 | 0.000 | 0.000 | ||
| 7 spectra, EQAQQIELK | 0.929 | 0.047 | 0.000 | 0.000 | 0.000 | 0.024 | 0.000 | 0.000 | ||
| 5 spectra, VSDIEPTMPFTK | 0.634 | 0.188 | 0.033 | 0.000 | 0.000 | 0.088 | 0.059 | 0.000 | ||
| 1 spectrum, MEESTAVPAQK | 0.548 | 0.000 | 0.030 | 0.000 | 0.000 | 0.000 | 0.422 | 0.000 | ||
| 4 spectra, ELDFWQEGWR | 1.000 | 0.000 | 0.000 | 0.000 | 0.000 | 0.000 | 0.000 | 0.000 | ||
| 2 spectra, LTSVSHK | 0.586 | 0.123 | 0.164 | 0.000 | 0.000 | 0.000 | 0.127 | 0.000 | ||
| 2 spectra, LSHDNTGAR | 0.570 | 0.000 | 0.000 | 0.375 | 0.000 | 0.056 | 0.000 | 0.000 | ||
| 2 spectra, LGCGILNYR | 0.896 | 0.000 | 0.044 | 0.000 | 0.000 | 0.000 | 0.060 | 0.000 | ||
| 2 spectra, DPNSIETLQSFGK | 0.915 | 0.085 | 0.000 | 0.000 | 0.000 | 0.000 | 0.000 | 0.000 | ||
| 1 spectrum, FLHTEIR | 0.958 | 0.000 | 0.000 | 0.000 | 0.000 | 0.000 | 0.000 | 0.042 | ||
| 1 spectrum, LEHEDPSDPQTPLIFK | 0.894 | 0.000 | 0.072 | 0.000 | 0.000 | 0.000 | 0.034 | 0.000 | ||
| 3 spectra, EVENFLR | 0.985 | 0.000 | 0.015 | 0.000 | 0.000 | 0.000 | 0.000 | 0.000 | ||
| 4 spectra, EDNNNLFSVQFR | 1.000 | 0.000 | 0.000 | 0.000 | 0.000 | 0.000 | 0.000 | 0.000 | ||
| 4 spectra, IFSQHLQNK | 0.635 | 0.057 | 0.123 | 0.000 | 0.051 | 0.134 | 0.000 | 0.000 | ||
| 1 spectrum, QIHEEALSK | 0.796 | 0.000 | 0.172 | 0.000 | 0.000 | 0.000 | 0.031 | 0.000 | ||
| 2 spectra, CSVNATPQQMPQAEK | 0.973 | 0.000 | 0.000 | 0.000 | 0.000 | 0.000 | 0.000 | 0.027 | ||
| 4 spectra, YLLNCDNMR | 0.959 | 0.041 | 0.000 | 0.000 | 0.000 | 0.000 | 0.000 | 0.000 | ||
| 1 spectrum, TLTPAGDLQETFSGMDQVK | 1.000 | 0.000 | 0.000 | 0.000 | 0.000 | 0.000 | 0.000 | 0.000 | ||
| 5 spectra, IAEMTDIKPILR | 1.000 | 0.000 | 0.000 | 0.000 | 0.000 | 0.000 | 0.000 | 0.000 | ||
| 2 spectra, VTHTGIFTLYSYR | 0.920 | 0.010 | 0.000 | 0.000 | 0.070 | 0.000 | 0.000 | 0.000 | ||
| 1 spectrum, GFEDDQIEALLHK | 0.661 | 0.000 | 0.063 | 0.000 | 0.000 | 0.000 | 0.277 | 0.000 | ||
| 1 spectrum, EFHITCGPDSLATDATK | 0.965 | 0.000 | 0.000 | 0.000 | 0.000 | 0.000 | 0.000 | 0.035 | ||
| 5 spectra, EQLFAVTHDK | 0.706 | 0.052 | 0.069 | 0.000 | 0.000 | 0.000 | 0.173 | 0.000 |
| Plot | Mito | Lyso or Perox | ER | Golgi | PM | Cytosol | Nucleus | ||||||
| Expt B |
9 peptides |
11 spectra |
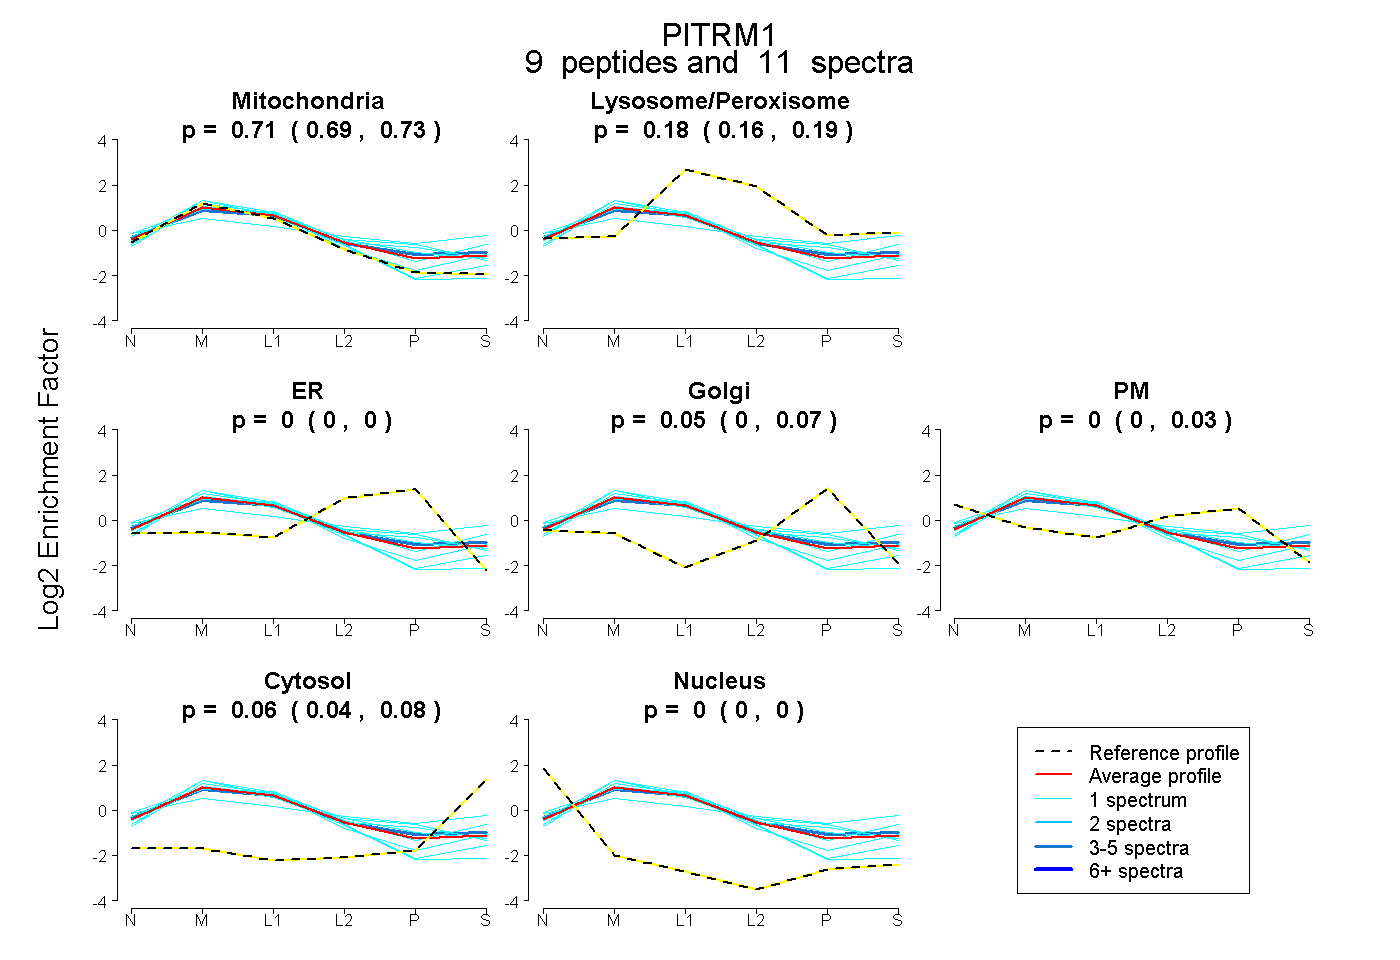 |
0.712 0.686 | 0.733 |
0.183 0.164 | 0.194 |
0.000 0.000 | 0.000 |
0.048 0.000 | 0.068 |
0.000 0.000 | 0.035 |
0.057 0.035 | 0.077 |
0.000 0.000 | 0.000 |
|||
| Plot | Lyso | Other | |||||||||||
| Expt C |
37 peptides |
267 spectra |
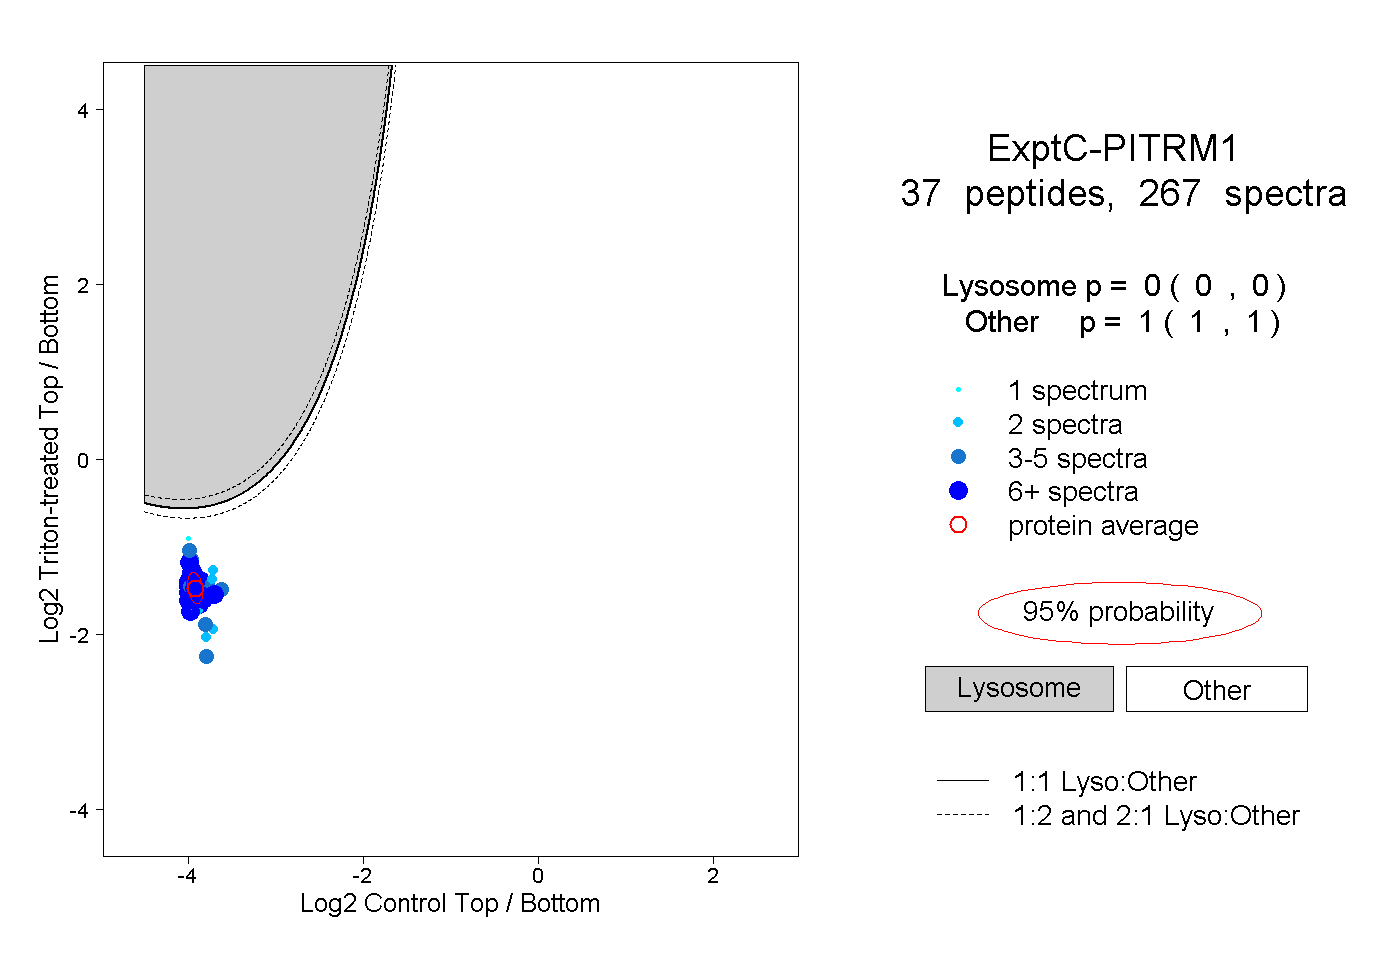 |
0.000 0.000 | 0.000 |
1.000 1.000 | 1.000 |
||||||||
| Plot | Lyso | Other | |||||||||||
| Expt D |
12 peptides |
28 spectra |
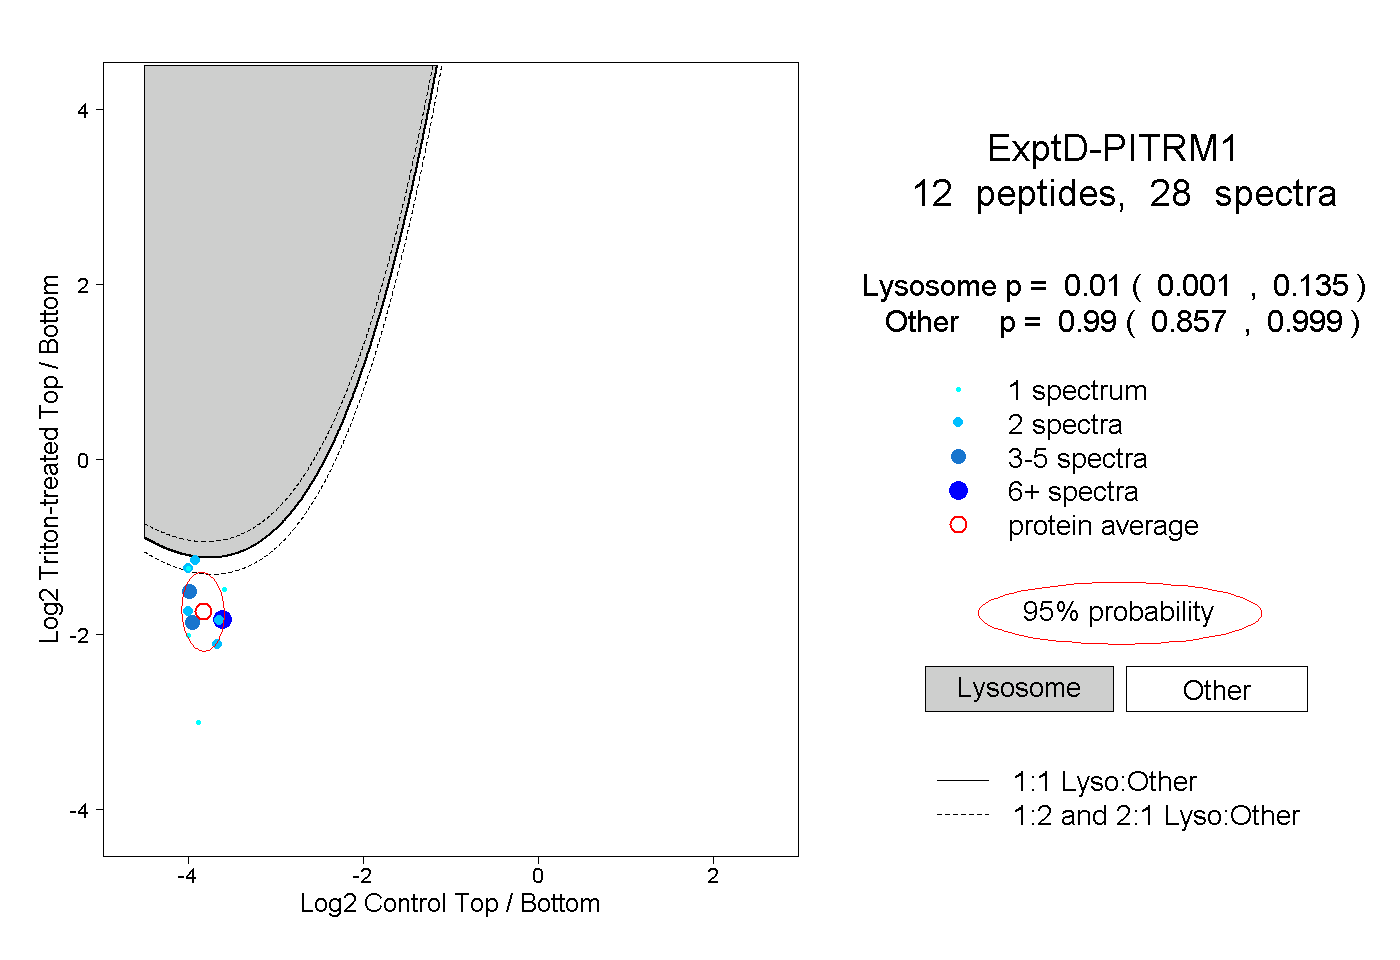 |
0.010 0.001 | 0.135 |
0.990 0.857 | 0.999 |