 3
3peptides
spectra
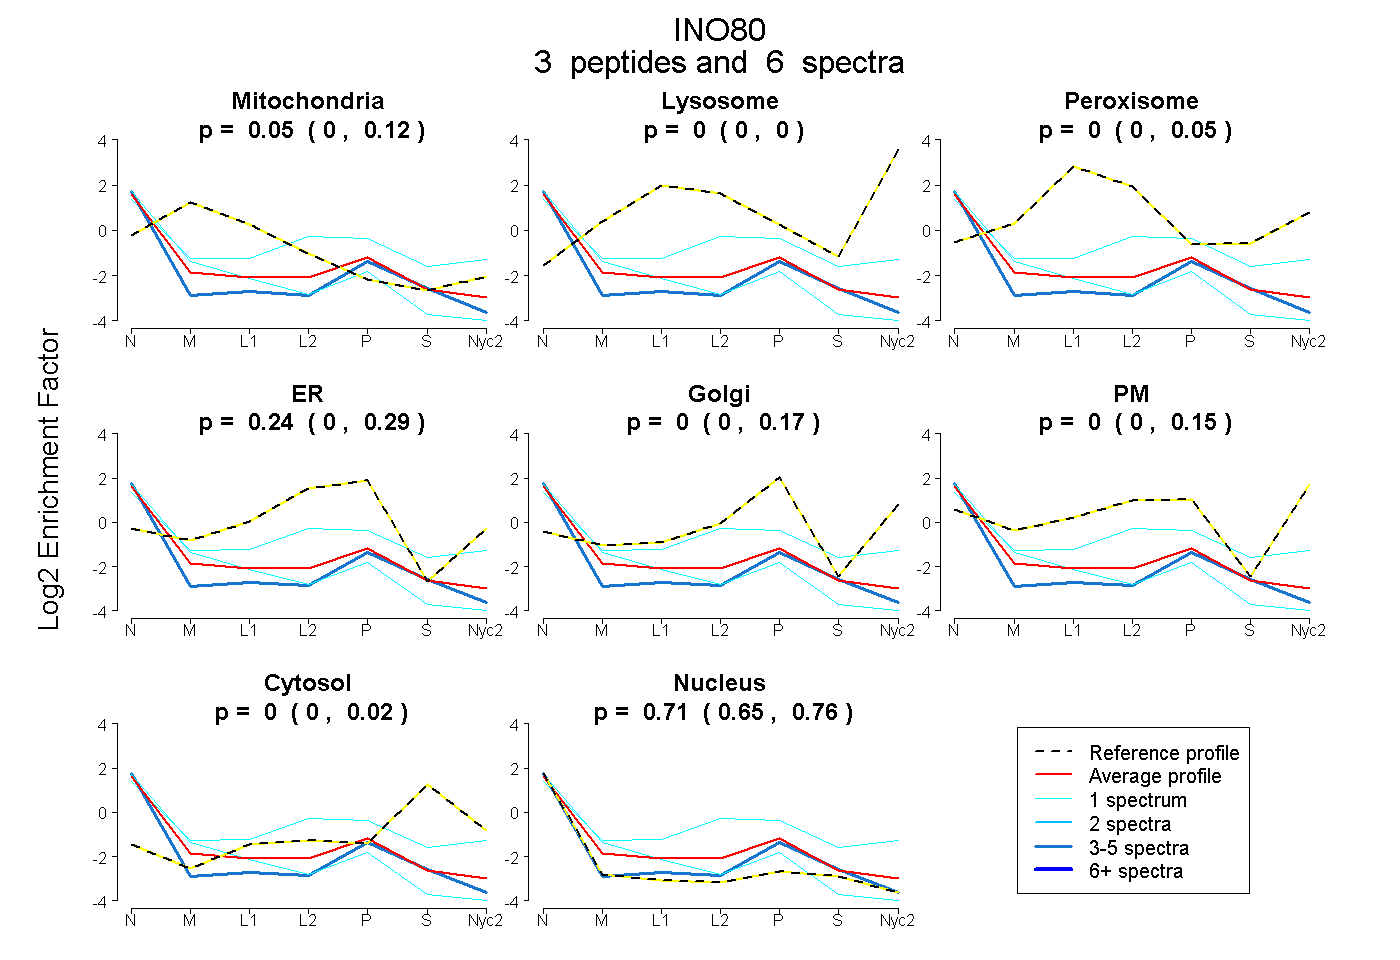
0.000 | 0.123
0.000 | 0.000
0.000 | 0.045
0.000 | 0.287
0.000 | 0.173
0.000 | 0.146
0.000 | 0.015
0.646 | 0.765
| Plot | Mito | Lyso | Perox | ER | Golgi | PM | Cytosol | Nucleus | |||||
| Expt A |
3 peptides |
6 spectra |
|
0.047 0.000 | 0.123 |
0.000 0.000 | 0.000 |
0.000 0.000 | 0.045 |
0.241 0.000 | 0.287 |
0.000 0.000 | 0.173 |
0.000 0.000 | 0.146 |
0.000 0.000 | 0.015 |
0.712 0.646 | 0.765 |
| 1 spectrum, DIESHAENK | 0.000 | 0.000 | 0.097 | 0.191 | 0.000 | 0.246 | 0.075 | 0.391 | ||
| 4 spectra, LDHFLR | 0.000 | 0.000 | 0.000 | 0.080 | 0.040 | 0.000 | 0.000 | 0.881 | ||
| 1 spectrum, VLIYSQMTR | 0.237 | 0.000 | 0.000 | 0.005 | 0.000 | 0.000 | 0.000 | 0.758 |
| Plot | Lyso | Other | |||||||||||
| Expt C |
2 peptides |
2 spectra |
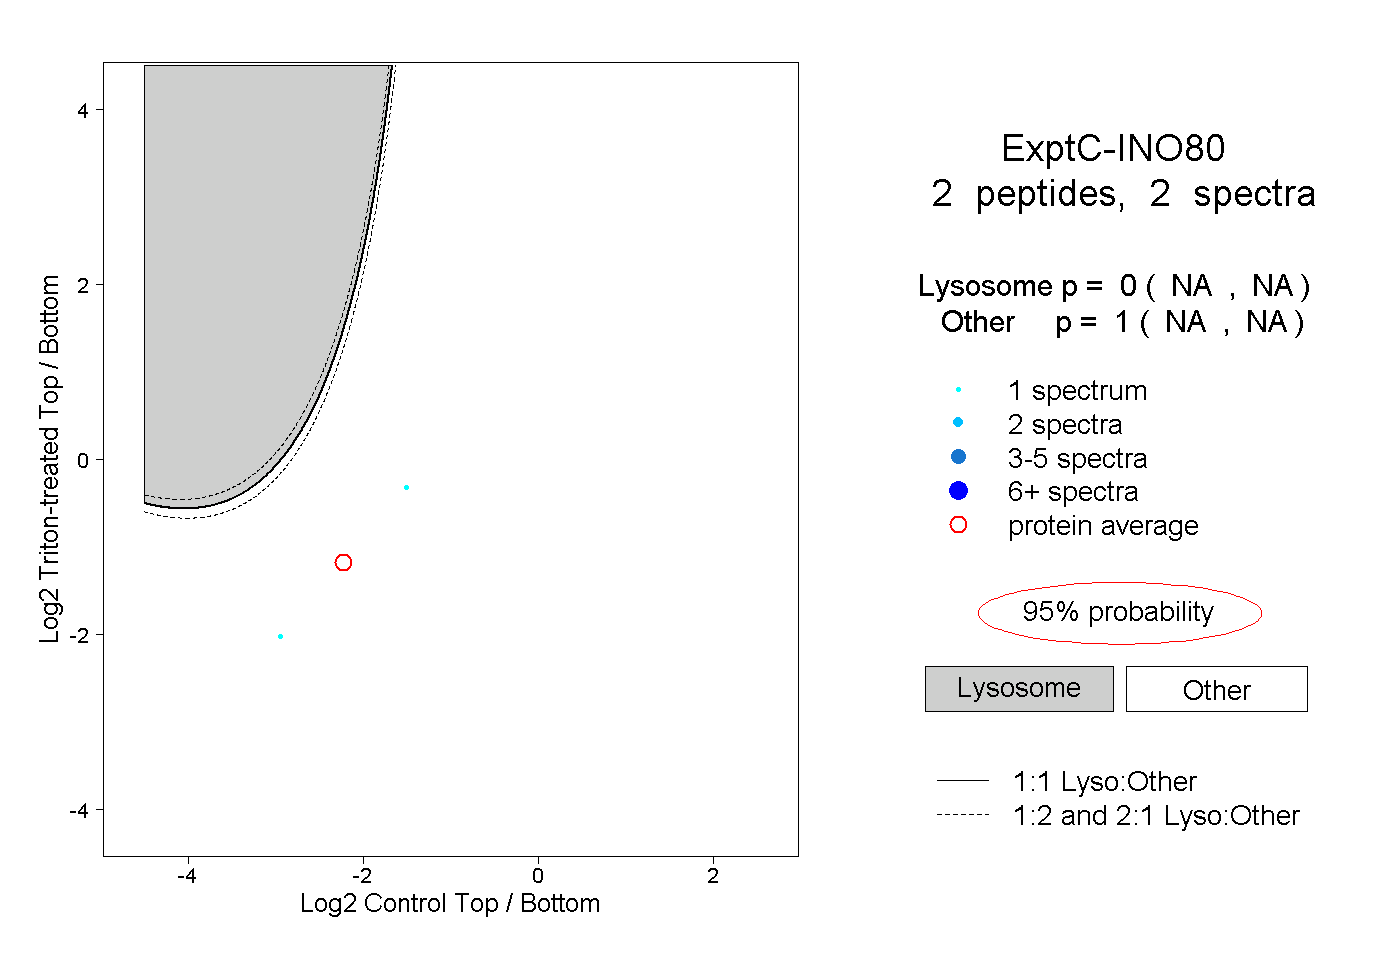 |
0.000 NA | NA |
1.000 NA | NA |