 6
6peptides
spectra
0.000 | 0.000
0.190 | 0.247
0.000 | 0.025
0.000 | 0.045
0.071 | 0.183
0.170 | 0.322
0.362 | 0.389
0.000 | 0.000
5peptides
spectra
0.000 | 0.000
1.000 | 1.000
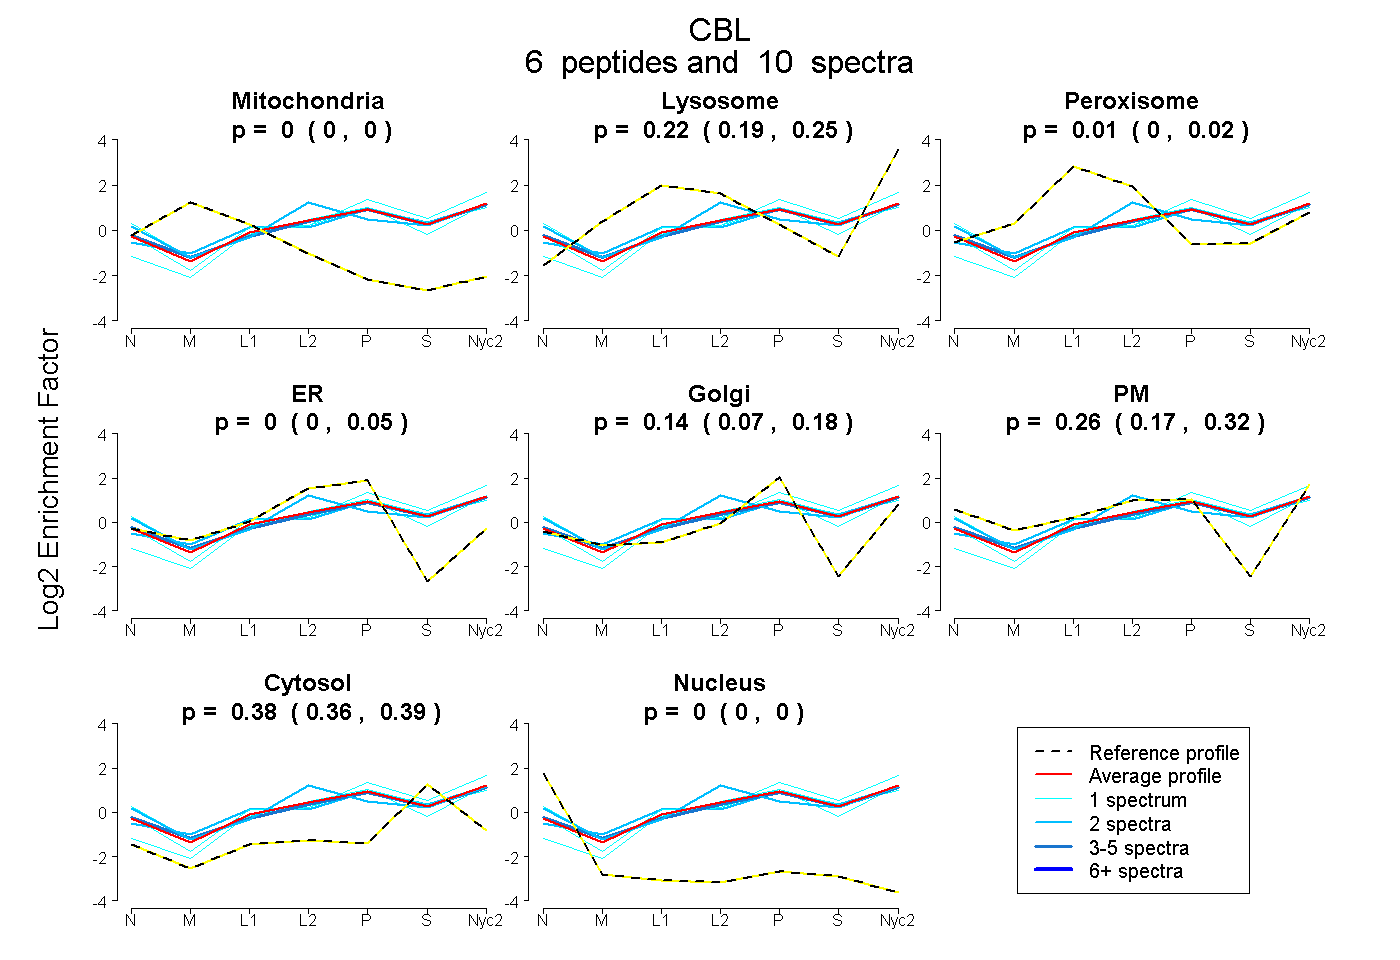
| Plot | Mito | Lyso | Perox | ER | Golgi | PM | Cytosol | Nucleus | |||||
| Expt A |
6 peptides |
10 spectra |
|
0.000 0.000 | 0.000 |
0.218 0.190 | 0.247 |
0.009 0.000 | 0.025 |
0.004 0.000 | 0.045 |
0.138 0.071 | 0.183 |
0.255 0.170 | 0.322 |
0.376 0.362 | 0.389 |
0.000 0.000 | 0.000 |
||
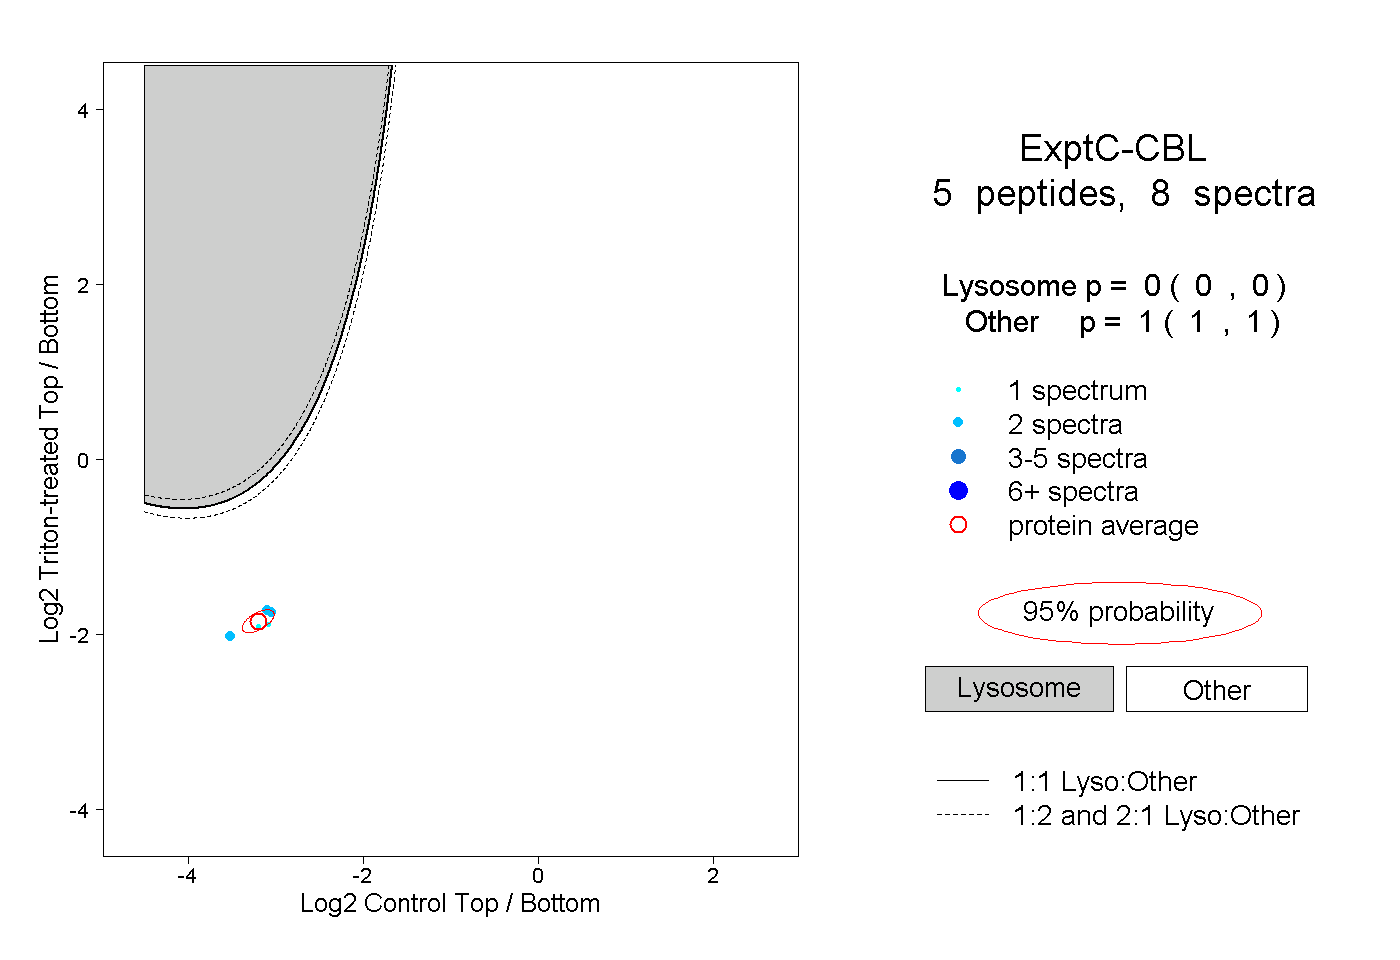
| Plot | Lyso | Other | |||||||||||
| Expt C |
5 peptides |
8 spectra |
|
0.000 0.000 | 0.000 |
1.000 1.000 | 1.000 |