 1
1peptide
spectrum
NA | NA
NA | NA
NA | NA
NA | NA
NA | NA
NA | NA
NA | NA
NA | NA
1peptide
spectra
0.008 | 0.211
0.781 | 0.991
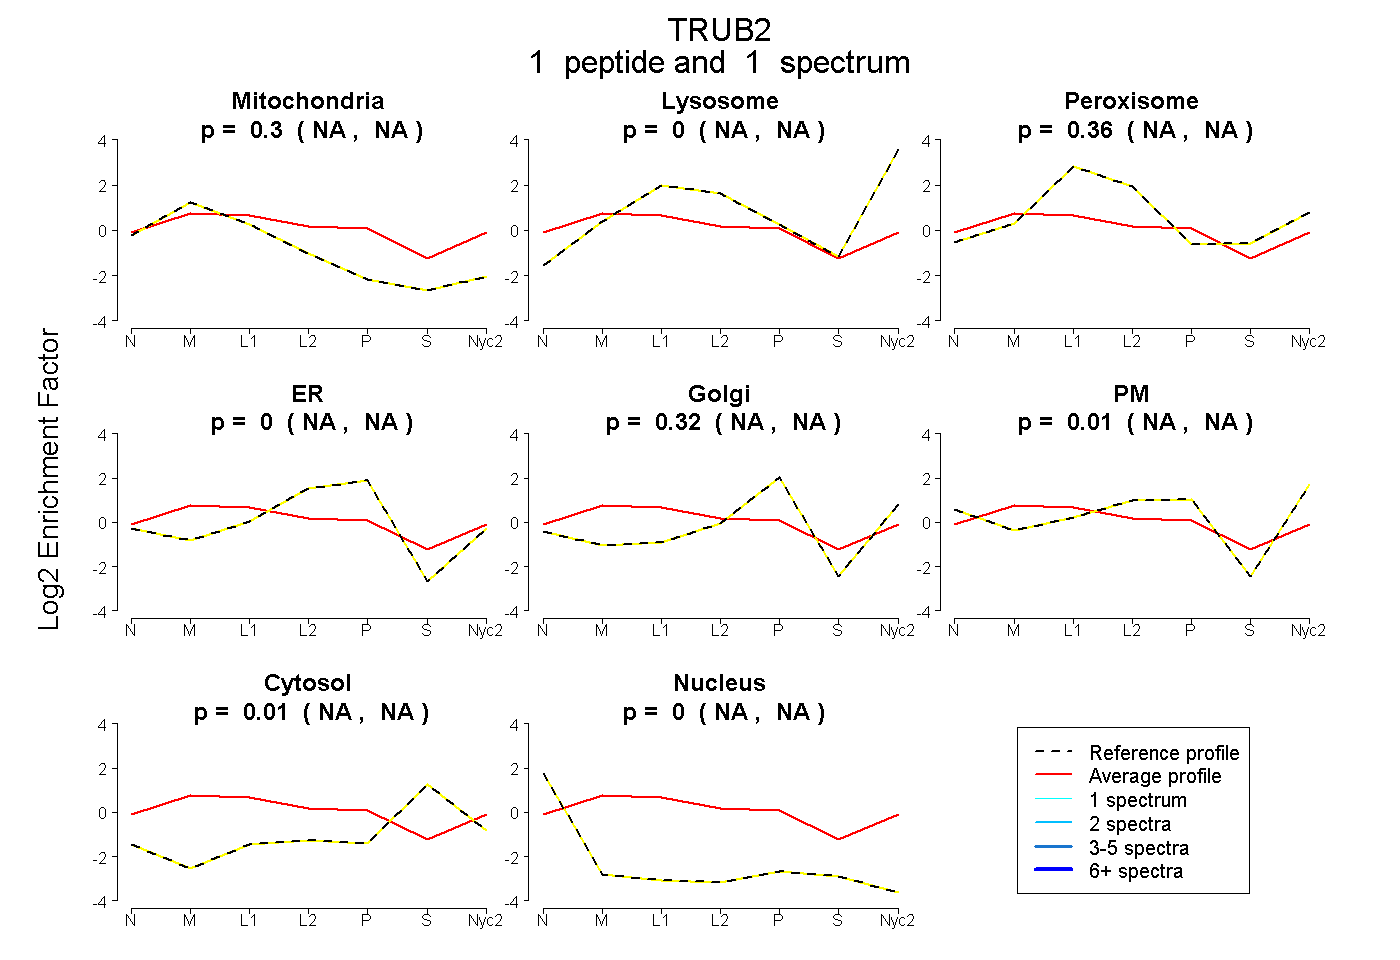
| Plot | Mito | Lyso | Perox | ER | Golgi | PM | Cytosol | Nucleus | |||||
| Expt A |
1 peptide |
1 spectrum |
|
0.304 NA | NA |
0.000 NA | NA |
0.361 NA | NA |
0.000 NA | NA |
0.316 NA | NA |
0.010 NA | NA |
0.008 NA | NA |
0.000 NA | NA |
||
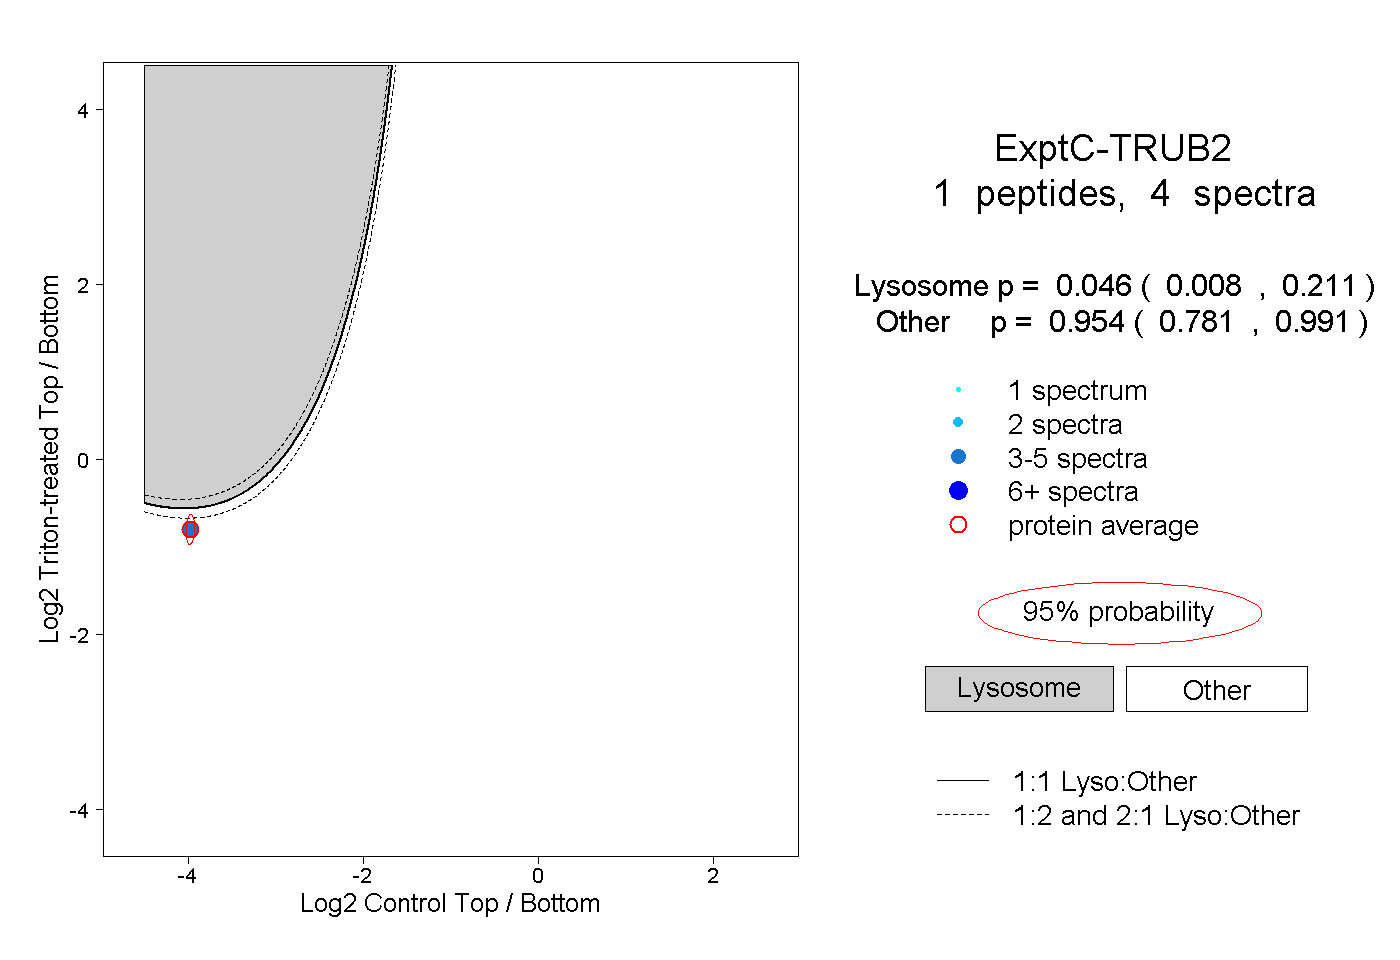
| Plot | Lyso | Other | |||||||||||
| Expt C |
1 peptide |
4 spectra |
|
0.046 0.008 | 0.211 |
0.954 0.781 | 0.991 |