 1
1peptide
spectra
0.000 | 0.015
0.000 | 0.000
0.000 | 0.002
0.505 | 0.607
0.000 | 0.117
0.000 | 0.000
0.351 | 0.395
0.000 | 0.000
1peptide
spectra
NA | NA
NA | NA
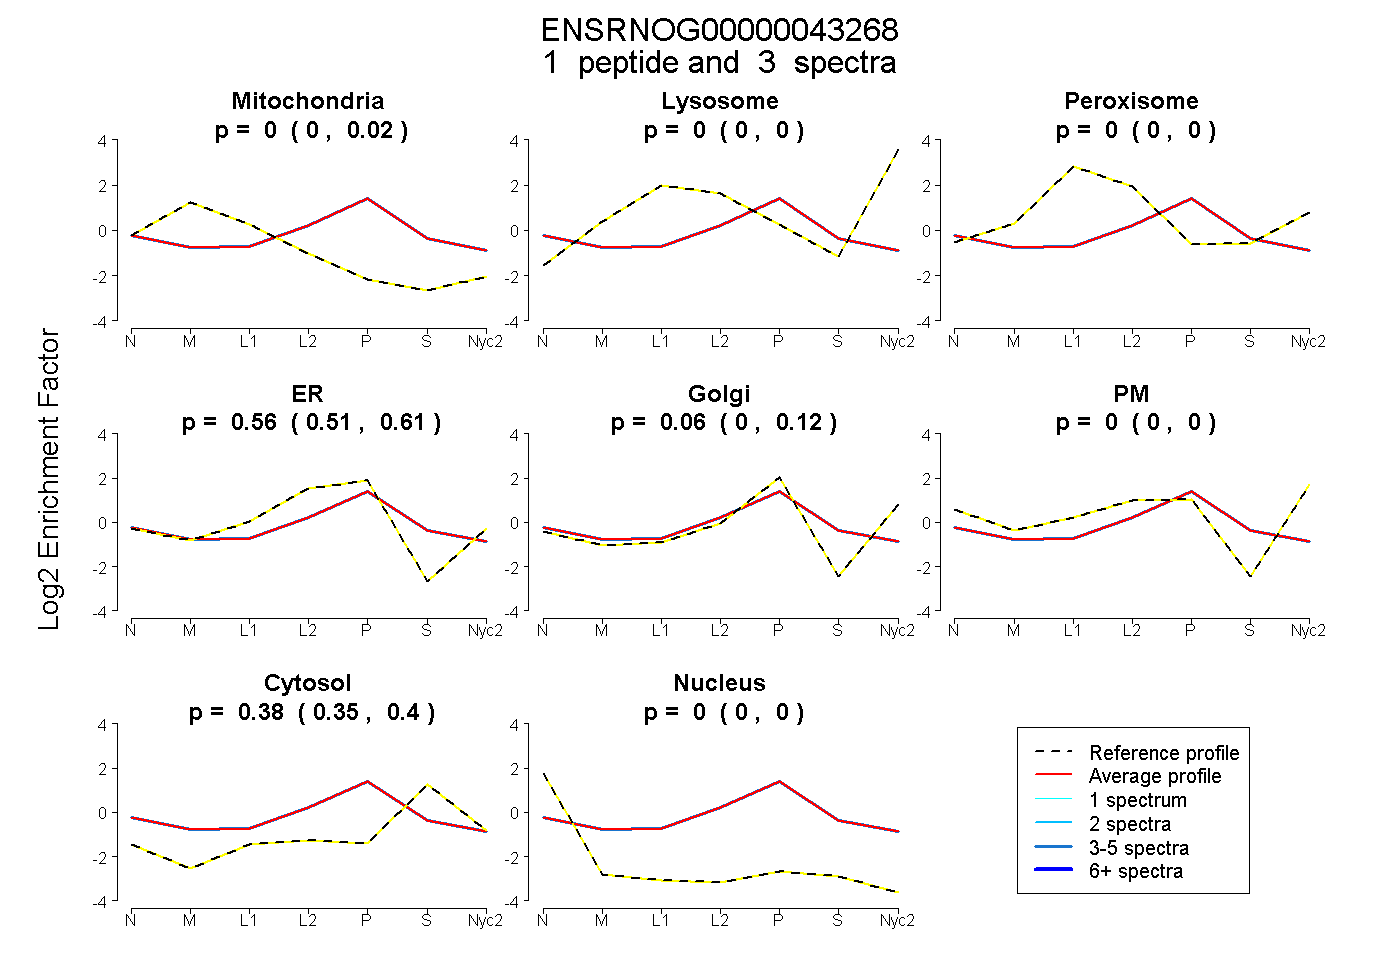
| Plot | Mito | Lyso | Perox | ER | Golgi | PM | Cytosol | Nucleus | |||||
| Expt A |
1 peptide |
3 spectra |
|
0.000 0.000 | 0.015 |
0.000 0.000 | 0.000 |
0.000 0.000 | 0.002 |
0.564 0.505 | 0.607 |
0.059 0.000 | 0.117 |
0.000 0.000 | 0.000 |
0.377 0.351 | 0.395 |
0.000 0.000 | 0.000 |
||
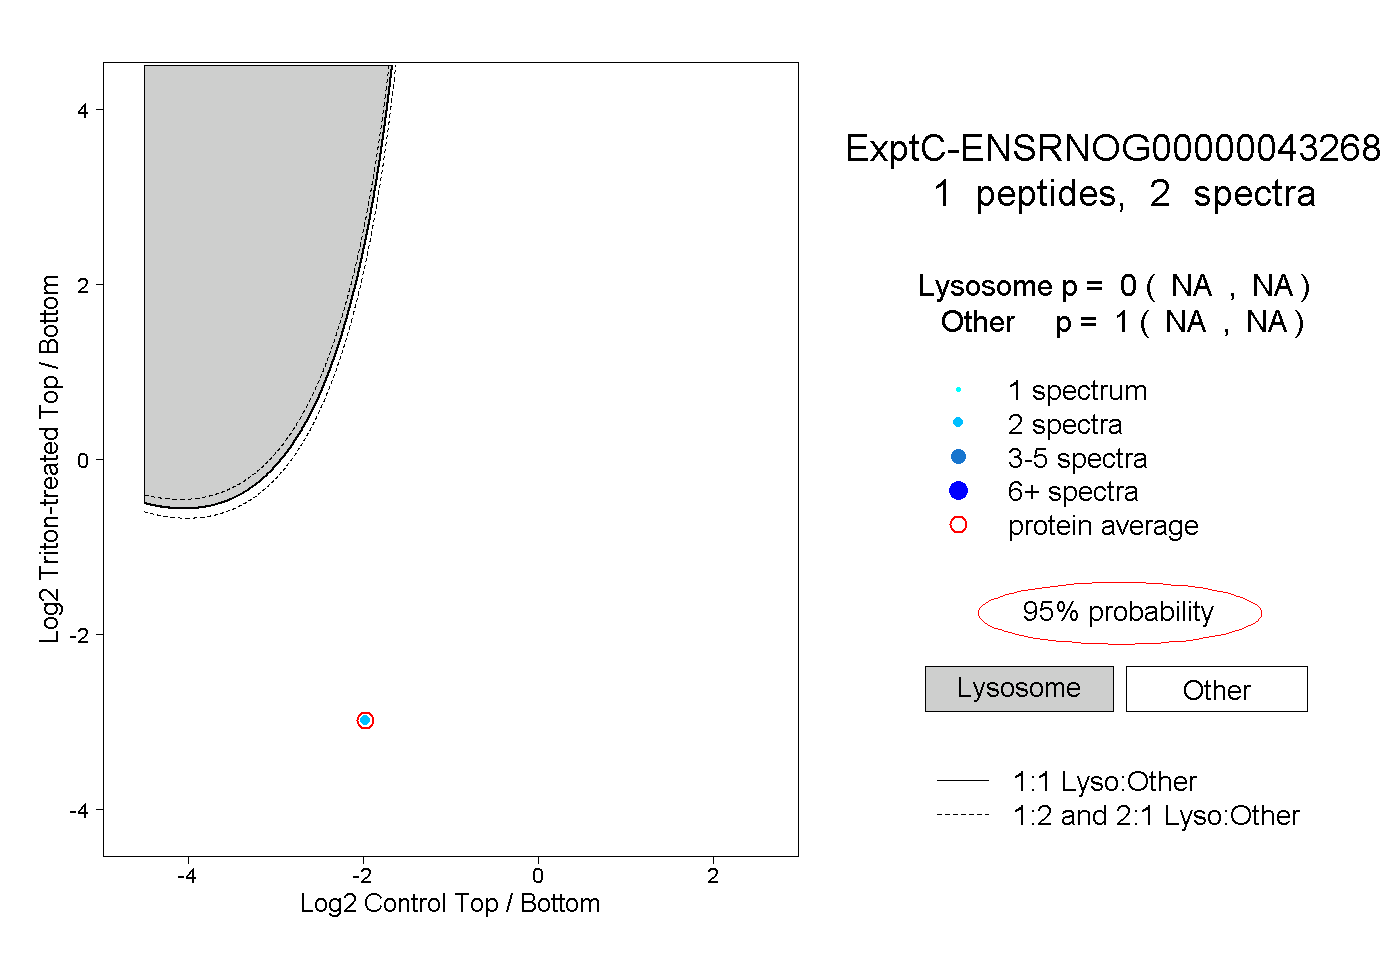
| Plot | Lyso | Other | |||||||||||
| Expt C |
1 peptide |
2 spectra |
|
0.000 NA | NA |
1.000 NA | NA |