 3
3peptides
spectra
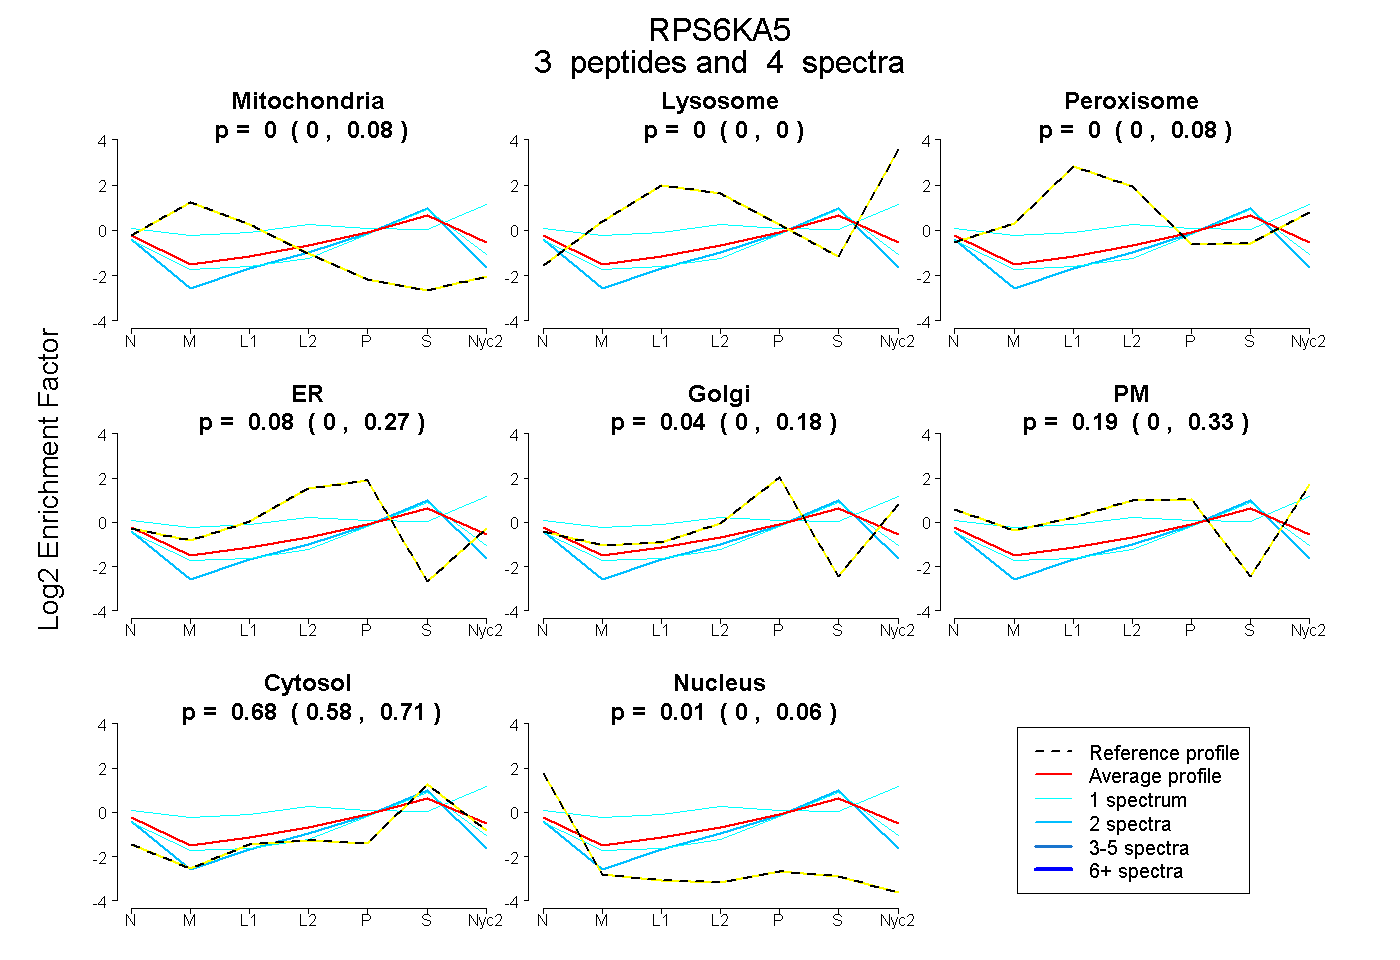
0.000 | 0.079
0.000 | 0.000
0.000 | 0.084
0.000 | 0.266
0.000 | 0.183
0.000 | 0.327
0.583 | 0.711
0.000 | 0.060
1peptide
spectrum
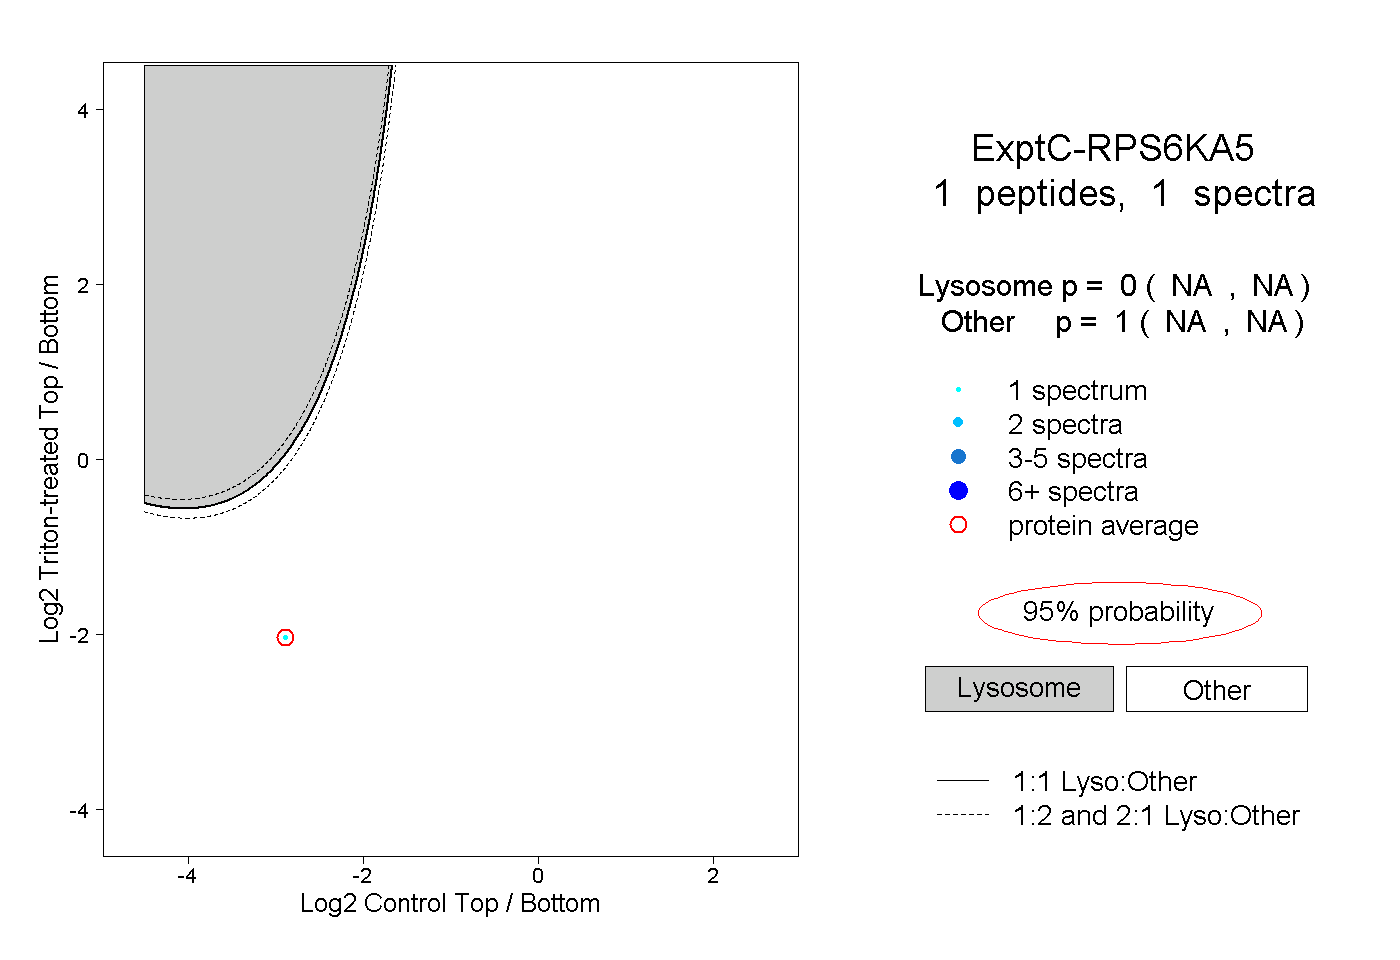
NA | NA
NA | NA
| Plot | Mito | Lyso | Perox | ER | Golgi | PM | Cytosol | Nucleus | |||||
| Expt A |
3 peptides |
4 spectra |
|
0.000 0.000 | 0.079 |
0.000 0.000 | 0.000 |
0.000 0.000 | 0.084 |
0.084 0.000 | 0.266 |
0.035 0.000 | 0.183 |
0.191 0.000 | 0.327 |
0.681 0.583 | 0.711 |
0.009 0.000 | 0.060 |
||
| Plot | Lyso | Other | |||||||||||
| Expt C |
1 peptide |
1 spectrum |
|
0.000 NA | NA |
1.000 NA | NA |