 8
8peptides
spectra
0.000 | 0.000
0.000 | 0.000
0.074 | 0.099
0.069 | 0.112
0.000 | 0.000
0.551 | 0.602
0.232 | 0.251
0.000 | 0.000
7peptides
spectra
0.000 | 0.000
1.000 | 1.000
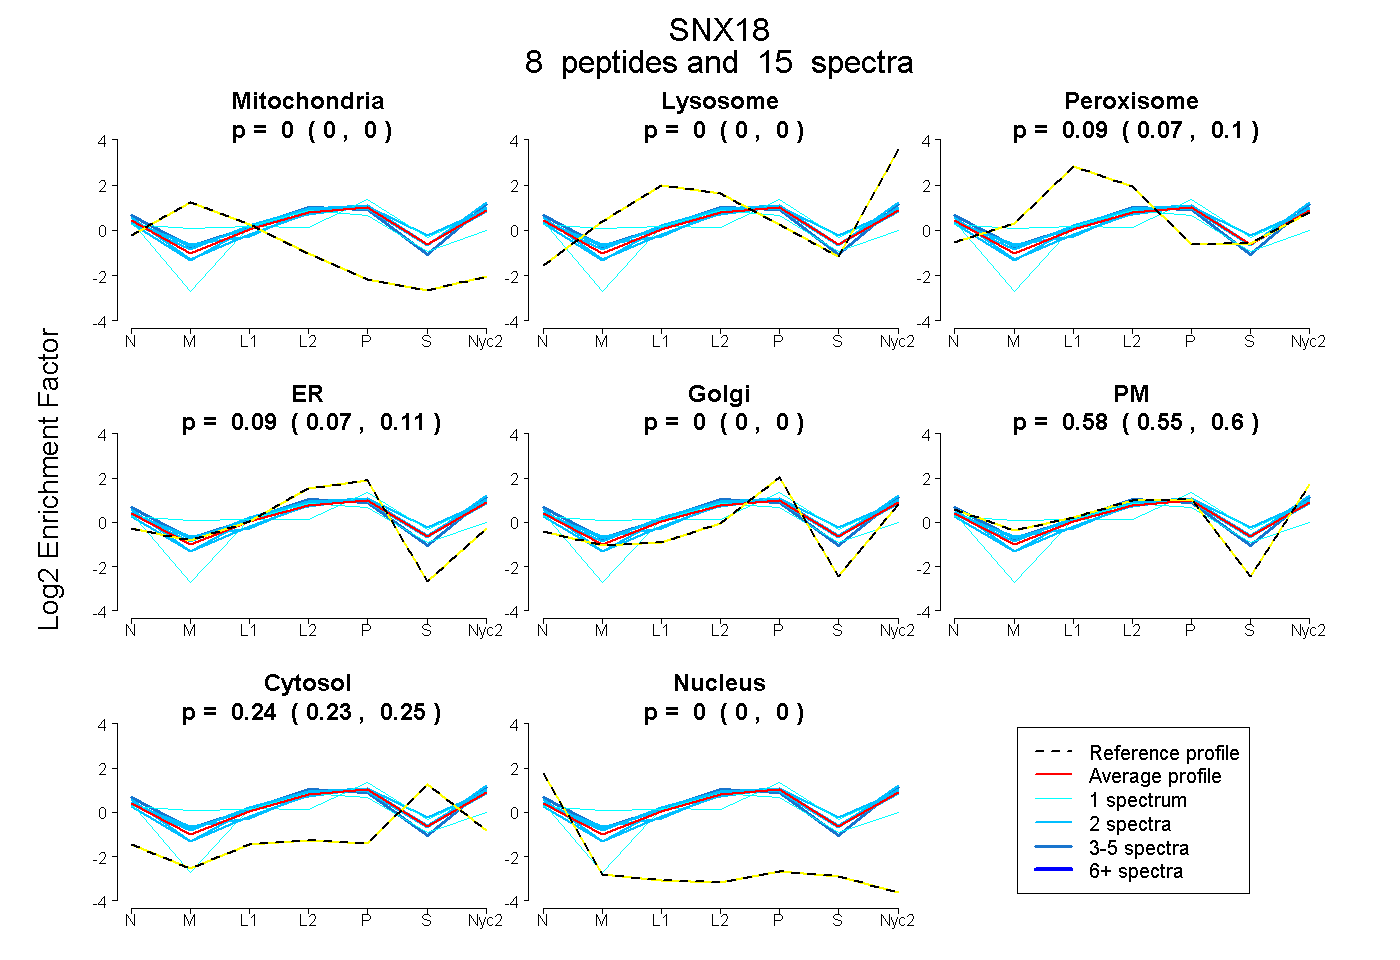
| Plot | Mito | Lyso | Perox | ER | Golgi | PM | Cytosol | Nucleus | |||||
| Expt A |
8 peptides |
15 spectra |
|
0.000 0.000 | 0.000 |
0.000 0.000 | 0.000 |
0.087 0.074 | 0.099 |
0.091 0.069 | 0.112 |
0.000 0.000 | 0.000 |
0.579 0.551 | 0.602 |
0.242 0.232 | 0.251 |
0.000 0.000 | 0.000 |
||
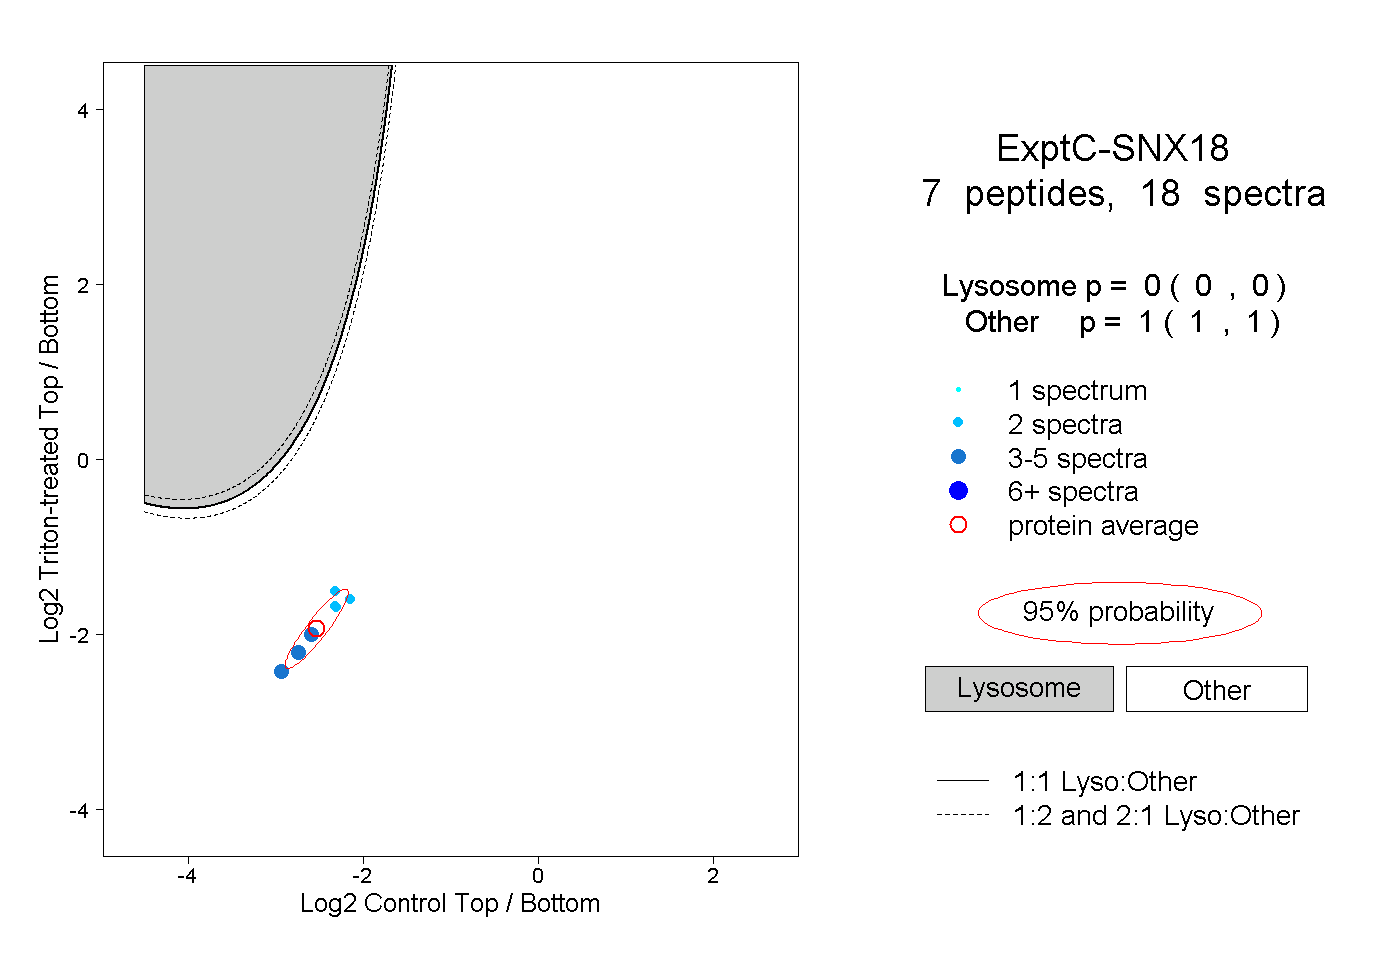
| Plot | Lyso | Other | |||||||||||
| Expt C |
7 peptides |
18 spectra |
|
0.000 0.000 | 0.000 |
1.000 1.000 | 1.000 |