 2
2peptides
spectra
0.000 | 0.000
0.000 | 0.065
0.000 | 0.059
0.000 | 0.000
0.000 | 0.047
0.374 | 0.452
0.484 | 0.551
0.000 | 0.000
1peptide
spectrum
NA | NA
NA | NA
NA | NA
NA | NA
NA | NA
NA | NA
NA | NA
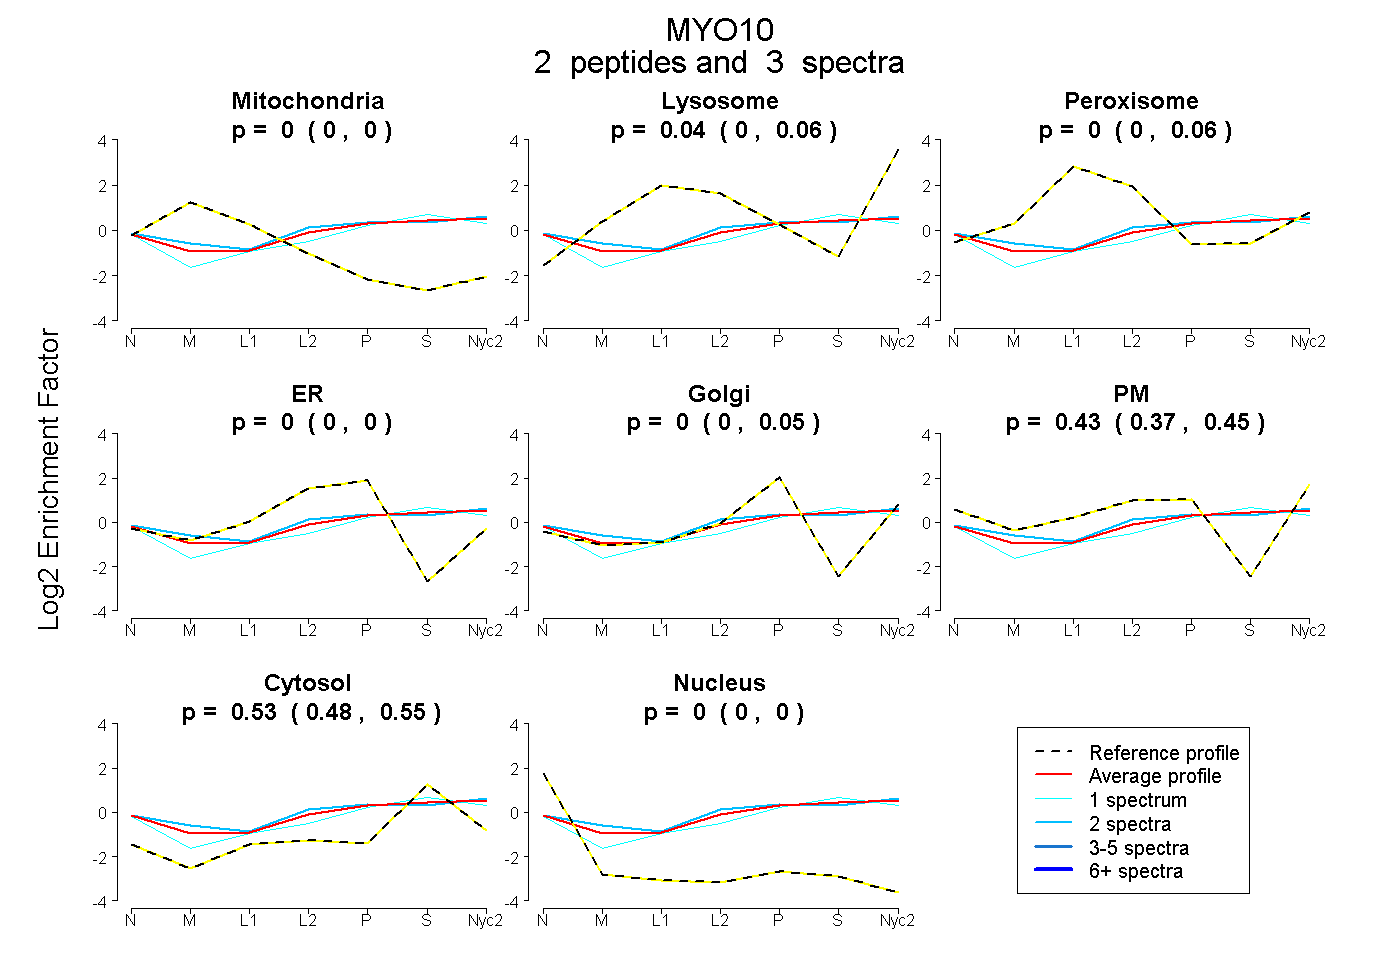
| Plot | Mito | Lyso | Perox | ER | Golgi | PM | Cytosol | Nucleus | |||||
| Expt A |
2 peptides |
3 spectra |
|
0.000 0.000 | 0.000 |
0.038 0.000 | 0.065 |
0.000 0.000 | 0.059 |
0.000 0.000 | 0.000 |
0.000 0.000 | 0.047 |
0.434 0.374 | 0.452 |
0.527 0.484 | 0.551 |
0.000 0.000 | 0.000 |
||
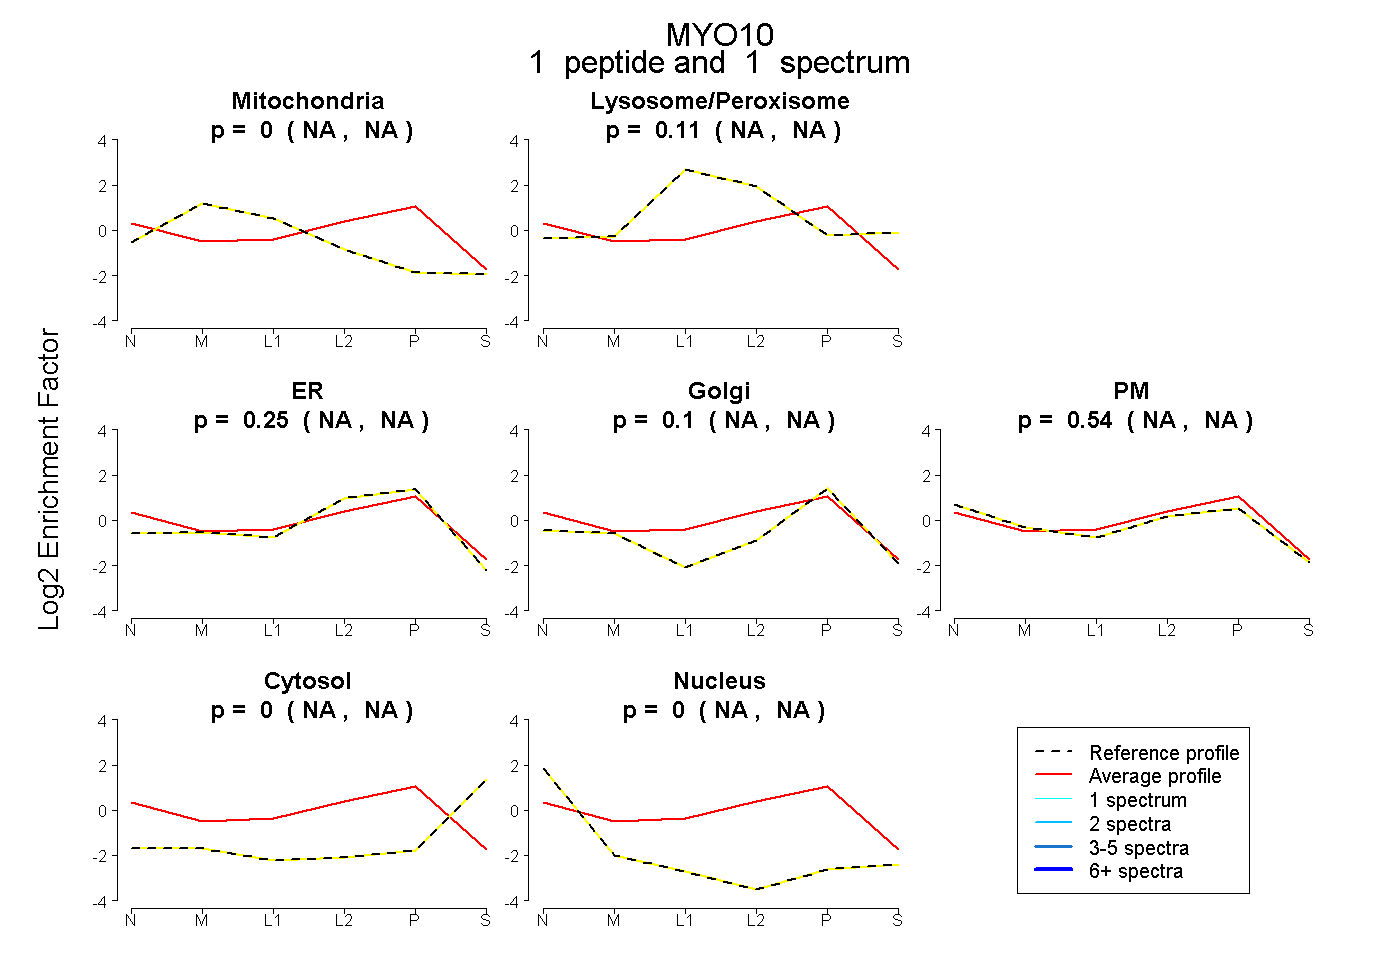
| Plot | Mito | Lyso or Perox | ER | Golgi | PM | Cytosol | Nucleus | ||||||
| Expt B |
1 peptide |
1 spectrum |
|
0.000 NA | NA |
0.109 NA | NA |
0.250 NA | NA |
0.098 NA | NA |
0.543 NA | NA |
0.000 NA | NA |
0.000 NA | NA |