 2
2peptides
spectra
NA | NA
NA | NA
NA | NA
NA | NA
NA | NA
NA | NA
NA | NA
NA | NA
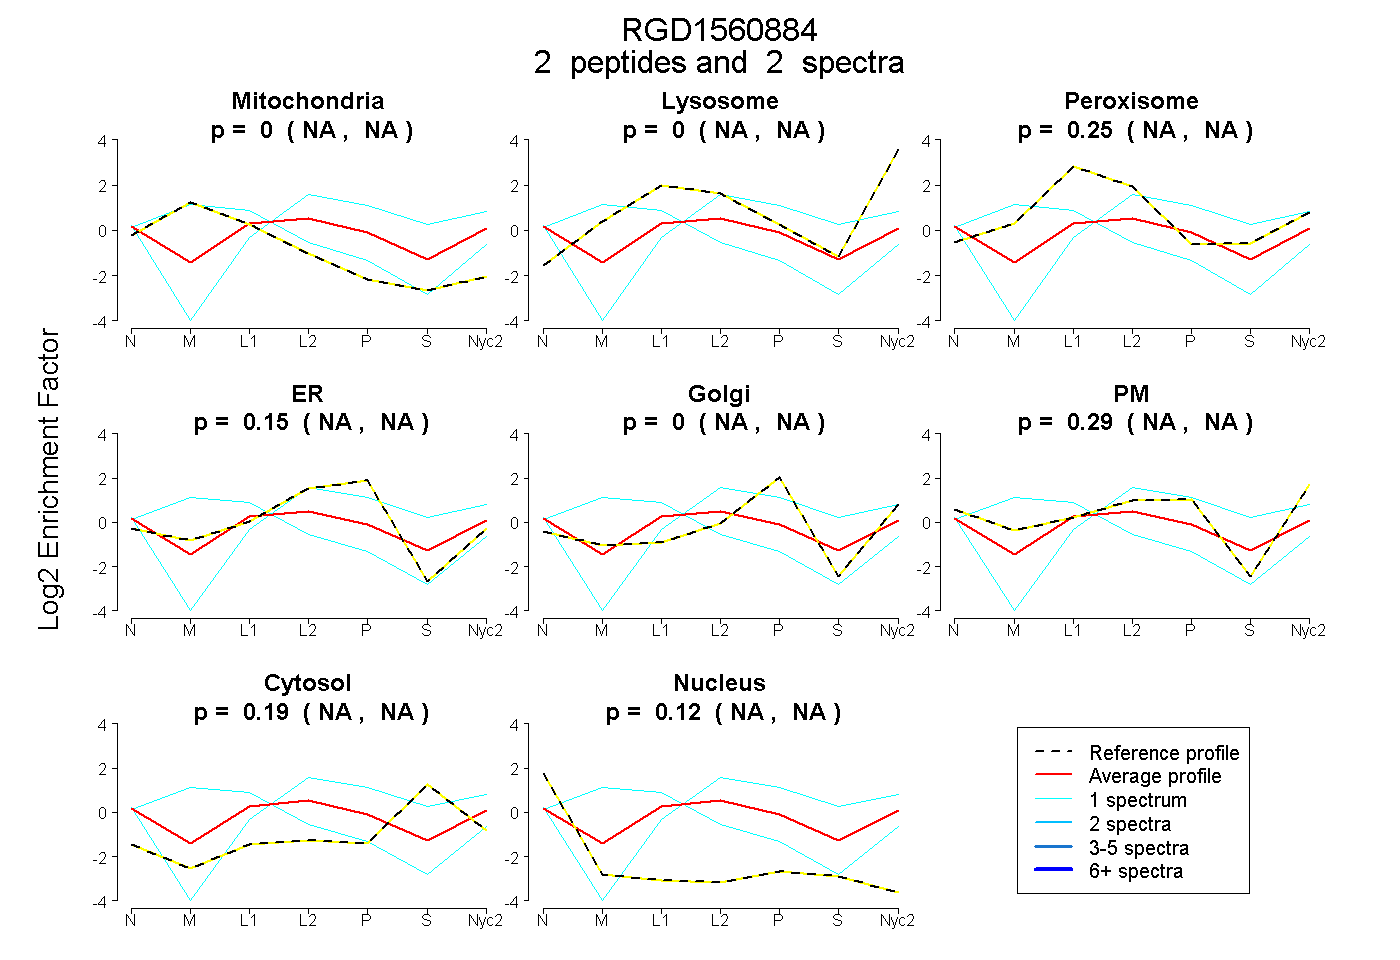
| Plot | Mito | Lyso | Perox | ER | Golgi | PM | Cytosol | Nucleus | |||||
| Expt A |
2 peptides |
2 spectra |
|
0.000 NA | NA |
0.000 NA | NA |
0.250 NA | NA |
0.152 NA | NA |
0.000 NA | NA |
0.288 NA | NA |
0.193 NA | NA |
0.118 NA | NA |
| 1 spectrum, DEMEAHVK | 0.709 | 0.085 | 0.013 | 0.000 | 0.000 | 0.192 | 0.000 | 0.000 | ||
| 1 spectrum, FEHDLEER | 0.000 | 0.007 | 0.000 | 0.319 | 0.000 | 0.228 | 0.445 | 0.000 |