 5
5peptides
spectra
0.000 | 0.000
0.041 | 0.112
0.000 | 0.030
0.000 | 0.058
0.000 | 0.036
0.000 | 0.072
0.839 | 0.881
0.000 | 0.000
| Plot | Mito | Lyso | Perox | ER | Golgi | PM | Cytosol | Nucleus | |||||
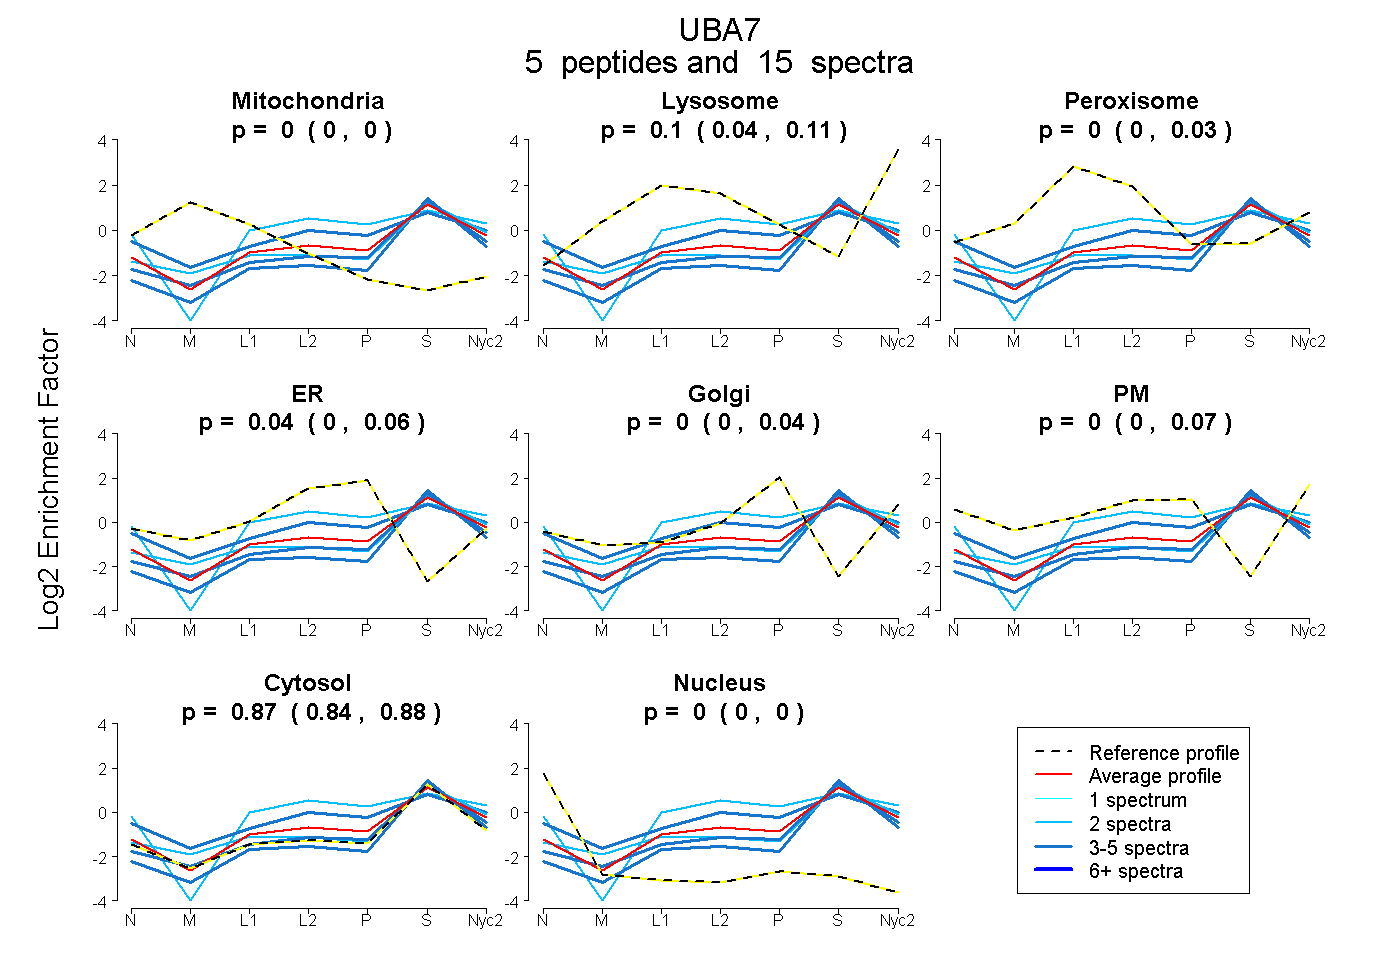
| Expt A |
5 peptides |
15 spectra |
|
0.000 0.000 | 0.000 |
0.095 0.041 | 0.112 |
0.000 0.000 | 0.030 |
0.037 0.000 | 0.058 |
0.000 0.000 | 0.036 |
0.003 0.000 | 0.072 |
0.865 0.839 | 0.881 |
0.000 0.000 | 0.000 |
| 3 spectra, DNGGVTIADMDHVER | 0.000 | 0.000 | 0.118 | 0.038 | 0.000 | 0.207 | 0.636 | 0.000 | ||
| 4 spectra, EESLDEALLR | 0.000 | 0.000 | 0.000 | 0.000 | 0.000 | 0.000 | 1.000 | 0.000 | ||
| 2 spectra, DGSLEIGDTTTFSR | 0.000 | 0.000 | 0.079 | 0.150 | 0.000 | 0.127 | 0.643 | 0.000 | ||
| 2 spectra, GDITEDLVR | 0.000 | 0.122 | 0.000 | 0.000 | 0.000 | 0.000 | 0.878 | 0.000 | ||
| 4 spectra, GFALVGLGVR | 0.000 | 0.043 | 0.000 | 0.000 | 0.000 | 0.000 | 0.957 | 0.000 |
| Plot | Mito | Lyso or Perox | ER | Golgi | PM | Cytosol | Nucleus | ||||||
| Expt B |
3 peptides |
5 spectra |
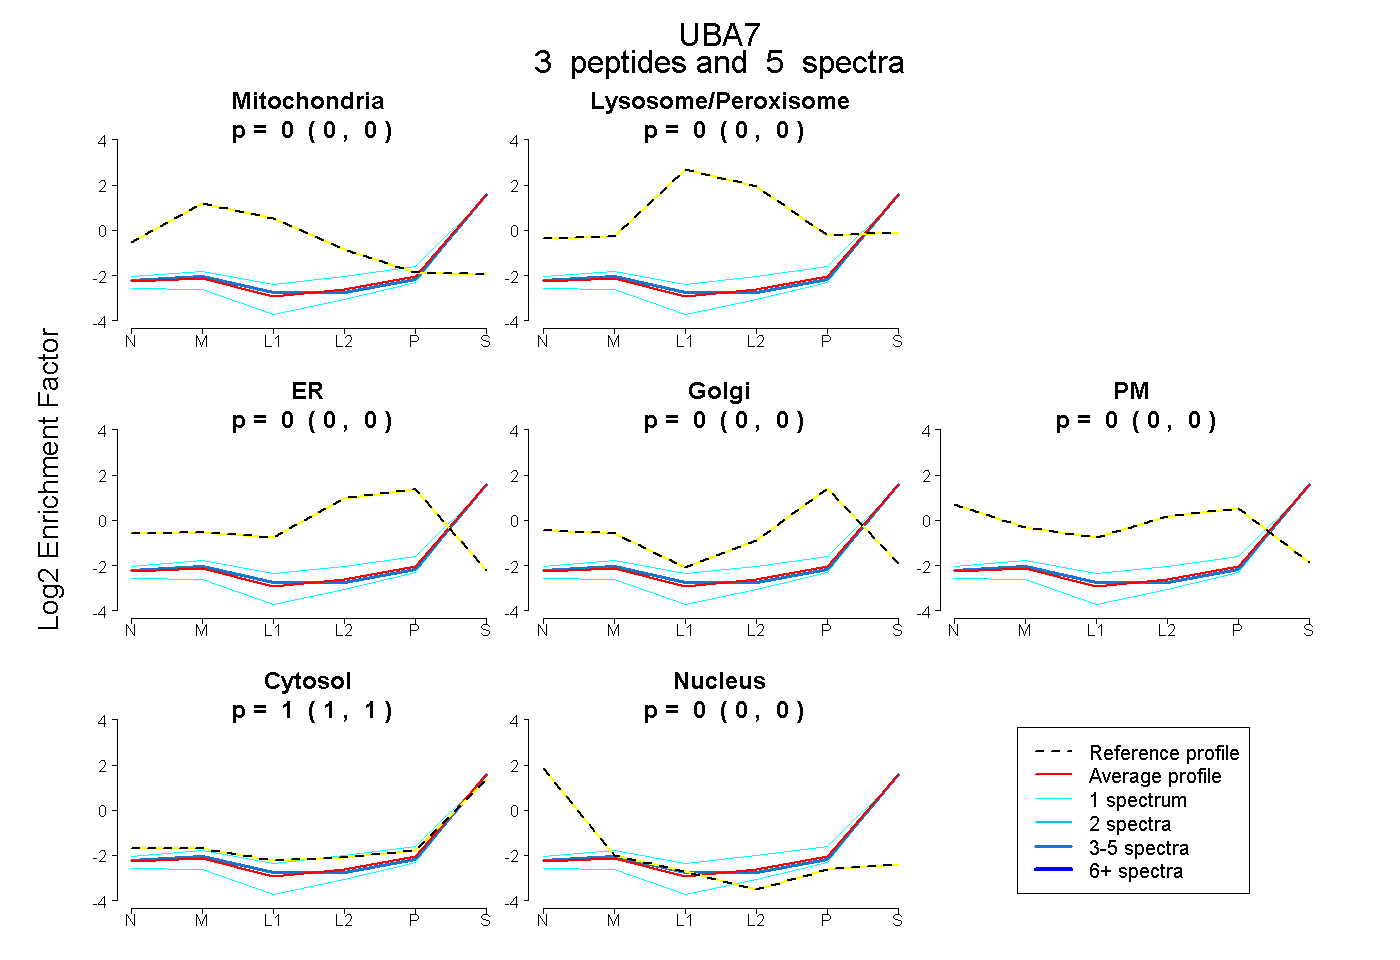 |
0.000 0.000 | 0.000 |
0.000 0.000 | 0.000 |
0.000 0.000 | 0.000 |
0.000 0.000 | 0.000 |
0.000 0.000 | 0.000 |
1.000 1.000 | 1.000 |
0.000 0.000 | 0.000 |
|||
| Plot | Lyso | Other | |||||||||||
| Expt C |
5 peptides |
11 spectra |
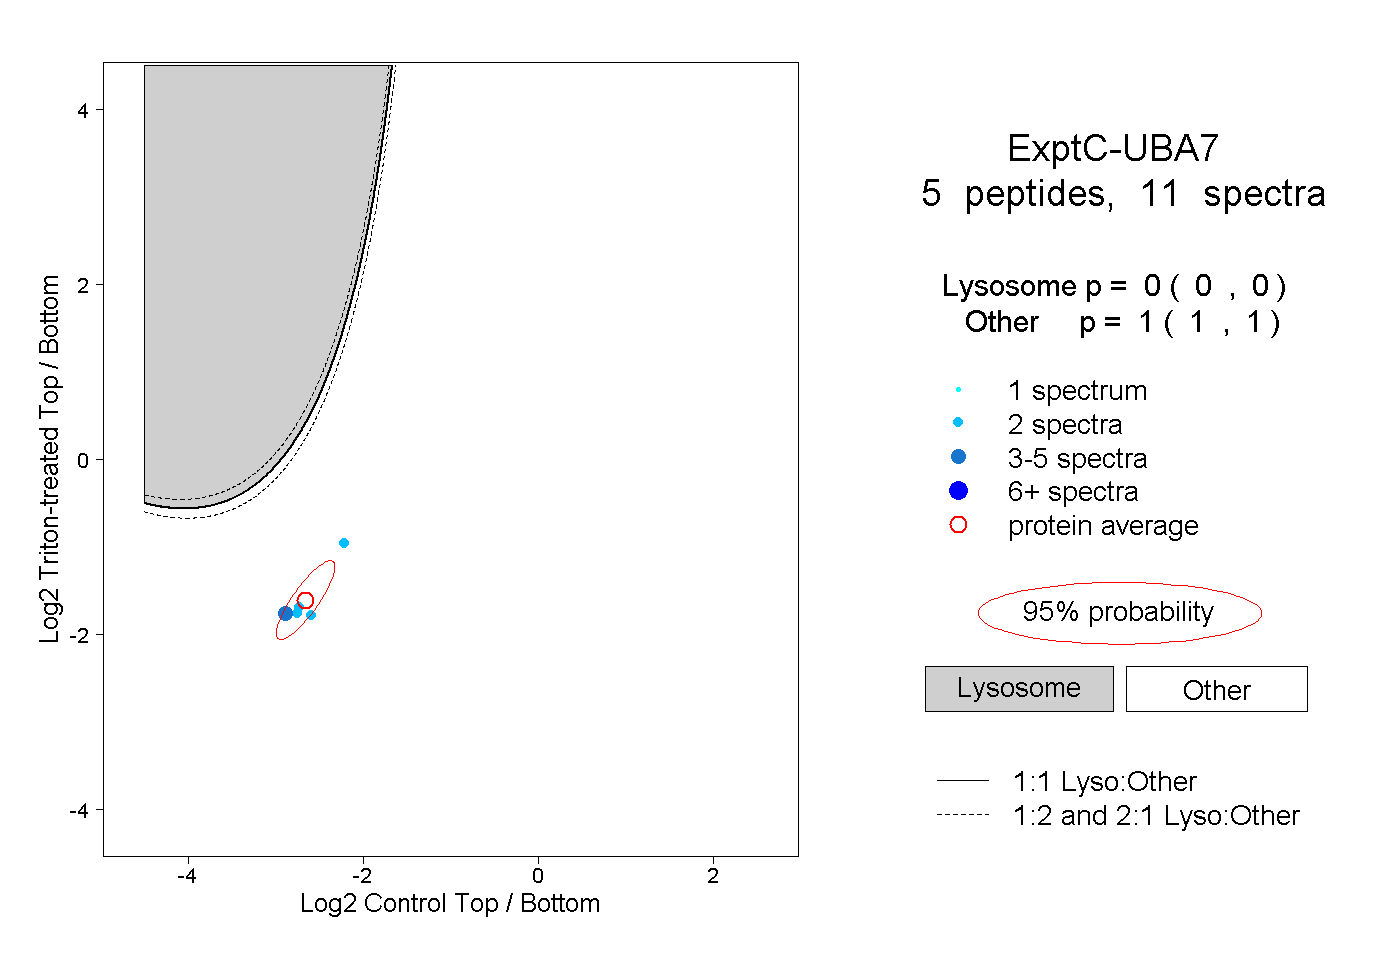 |
0.000 0.000 | 0.000 |
1.000 1.000 | 1.000 |