13
13peptides
spectra
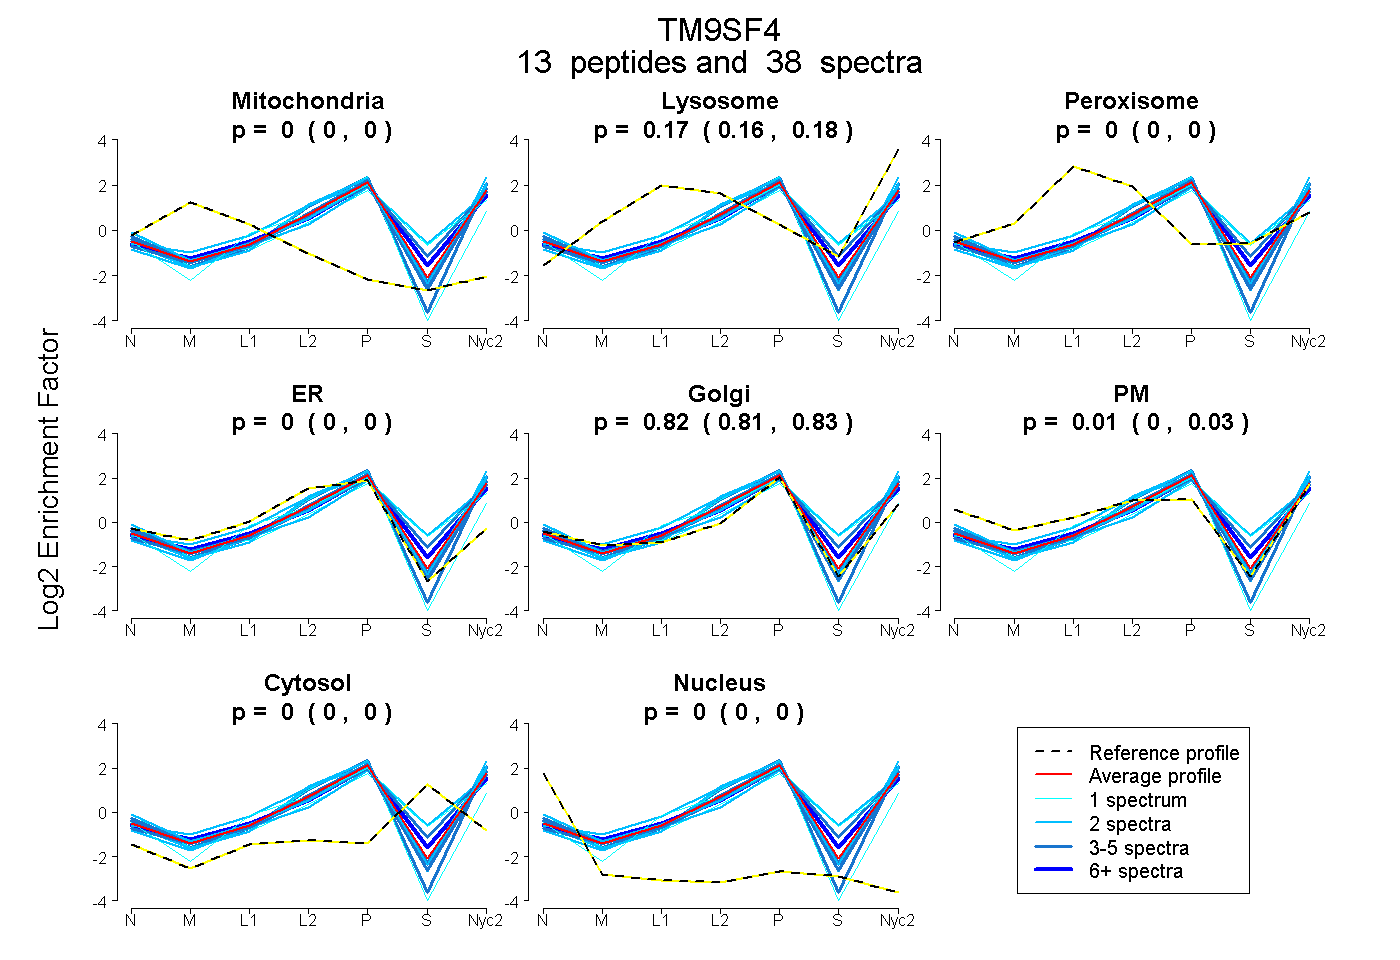
0.000 | 0.000
0.157 | 0.176
0.000 | 0.000
0.000 | 0.000
0.807 | 0.825
0.000 | 0.030
0.000 | 0.000
0.000 | 0.000
7peptides
spectra
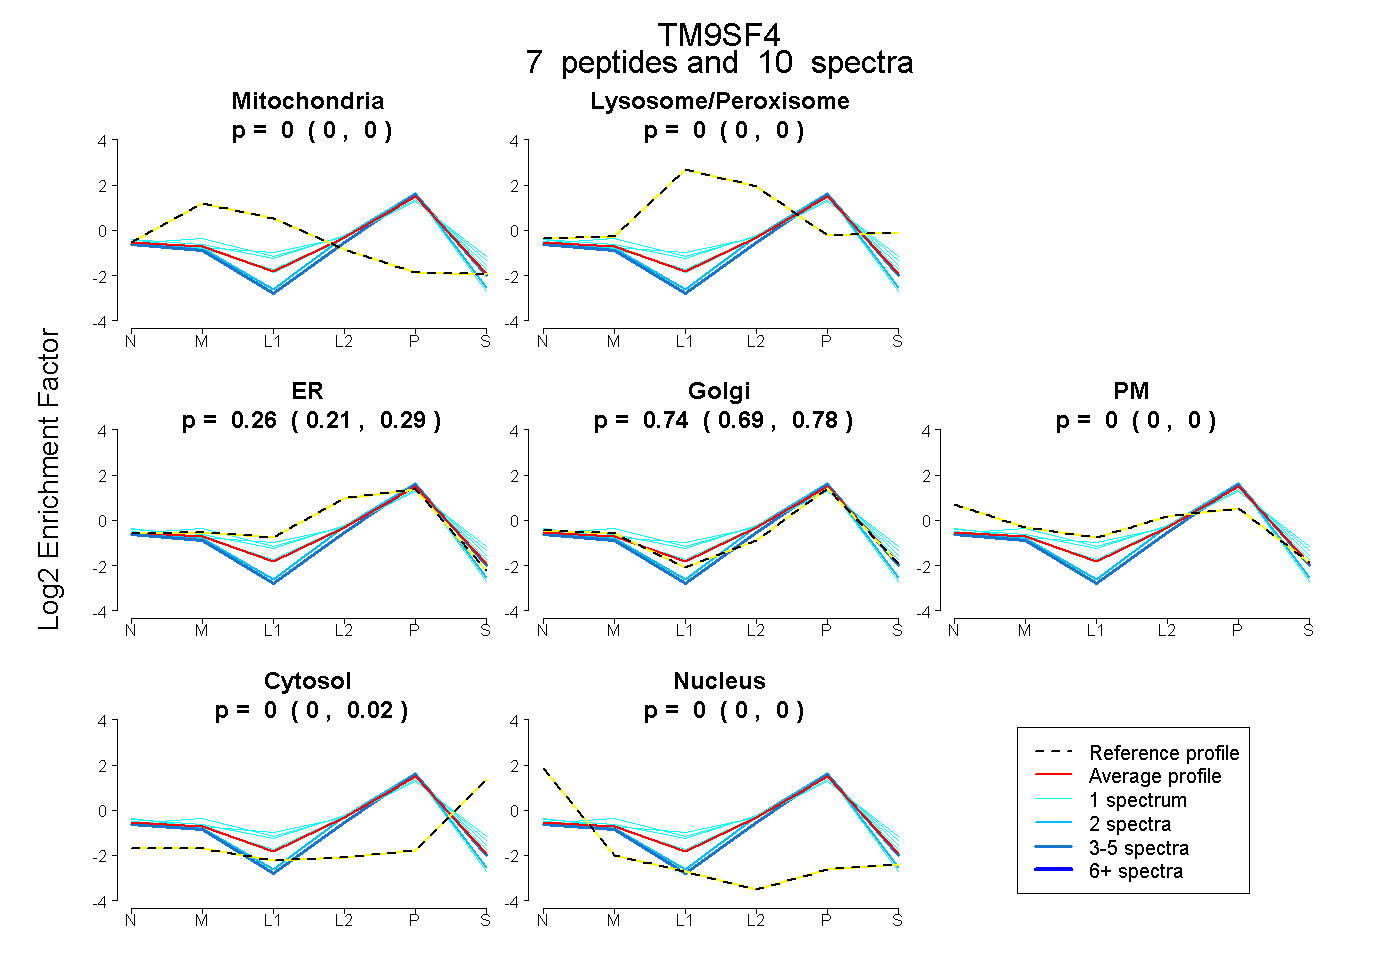
0.000 | 0.000
0.000 | 0.000
0.213 | 0.292
0.694 | 0.776
0.000 | 0.000
0.000 | 0.019
0.000 | 0.000