 8
8peptides
spectra
0.000 | 0.000
0.000 | 0.000
0.000 | 0.000
0.000 | 0.000
0.080 | 0.145
0.617 | 0.669
0.117 | 0.188
0.064 | 0.101
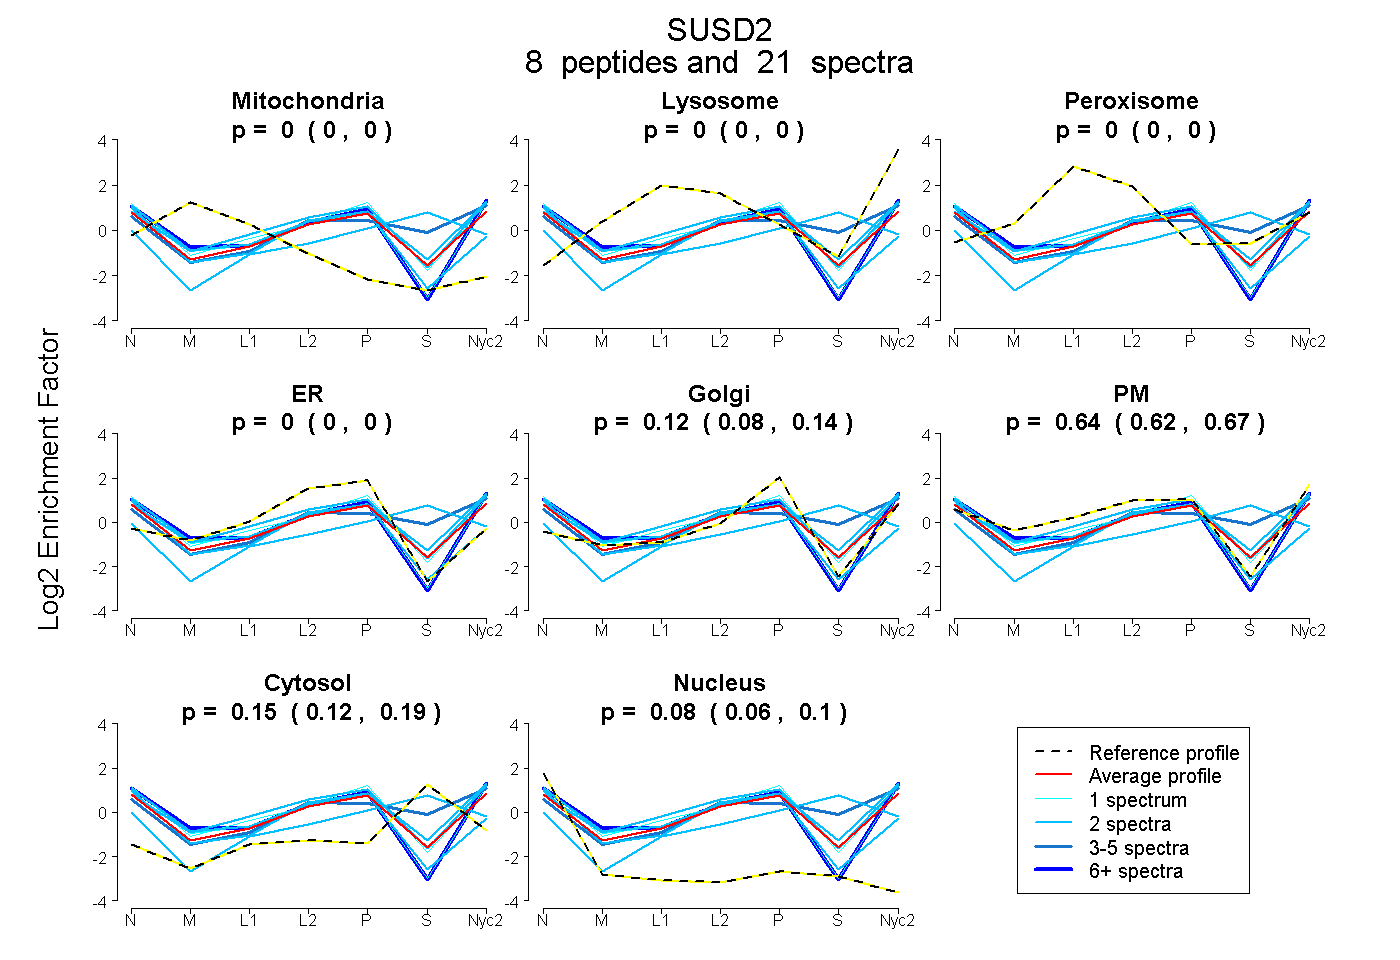
| Plot | Mito | Lyso | Perox | ER | Golgi | PM | Cytosol | Nucleus | |||||
| Expt A |
8 peptides |
21 spectra |
|
0.000 0.000 | 0.000 |
0.000 0.000 | 0.000 |
0.000 0.000 | 0.000 |
0.000 0.000 | 0.000 |
0.116 0.080 | 0.145 |
0.645 0.617 | 0.669 |
0.155 0.117 | 0.188 |
0.084 0.064 | 0.101 |
| 2 spectra, WTDSITSVICR | 0.000 | 0.000 | 0.000 | 0.351 | 0.000 | 0.435 | 0.000 | 0.214 | ||
| 1 spectrum, GLLGTLNDNPEDDFTLR | 0.000 | 0.000 | 0.000 | 0.000 | 0.034 | 0.829 | 0.000 | 0.137 | ||
| 7 spectra, FLSHTR | 0.000 | 0.000 | 0.000 | 0.000 | 0.089 | 0.794 | 0.000 | 0.116 | ||
| 4 spectra, IAHQLHQHR | 0.000 | 0.000 | 0.000 | 0.000 | 0.000 | 0.596 | 0.404 | 0.000 | ||
| 2 spectra, LLSFTEQNWMDLK | 0.000 | 0.000 | 0.000 | 0.000 | 0.093 | 0.670 | 0.190 | 0.047 | ||
| 2 spectra, VADGSQVLEVLLNQK | 0.000 | 0.000 | 0.000 | 0.000 | 0.112 | 0.181 | 0.706 | 0.000 | ||
| 1 spectrum, DFVVQHLK | 0.000 | 0.000 | 0.000 | 0.000 | 0.257 | 0.615 | 0.079 | 0.049 | ||
| 2 spectra, RPSSDCR | 0.000 | 0.000 | 0.000 | 0.000 | 0.051 | 0.802 | 0.128 | 0.019 |
| Plot | Mito | Lyso or Perox | ER | Golgi | PM | Cytosol | Nucleus | ||||||
| Expt B |
1 peptide |
1 spectrum |
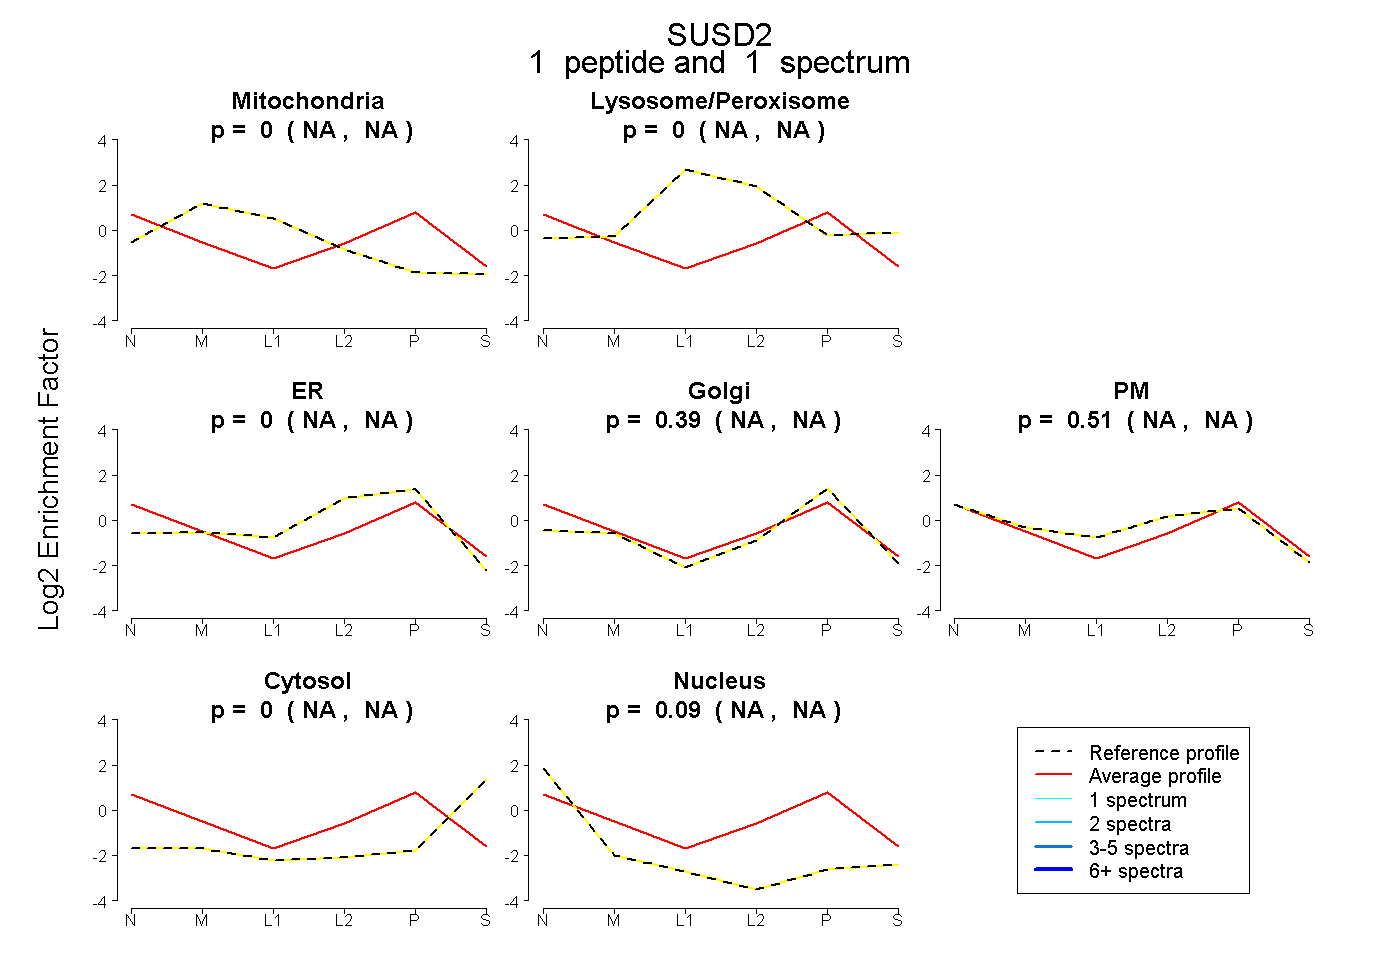 |
0.000 NA | NA |
0.000 NA | NA |
0.000 NA | NA |
0.393 NA | NA |
0.515 NA | NA |
0.002 NA | NA |
0.090 NA | NA |
|||
| Plot | Lyso | Other | |||||||||||
| Expt C |
5 peptides |
8 spectra |
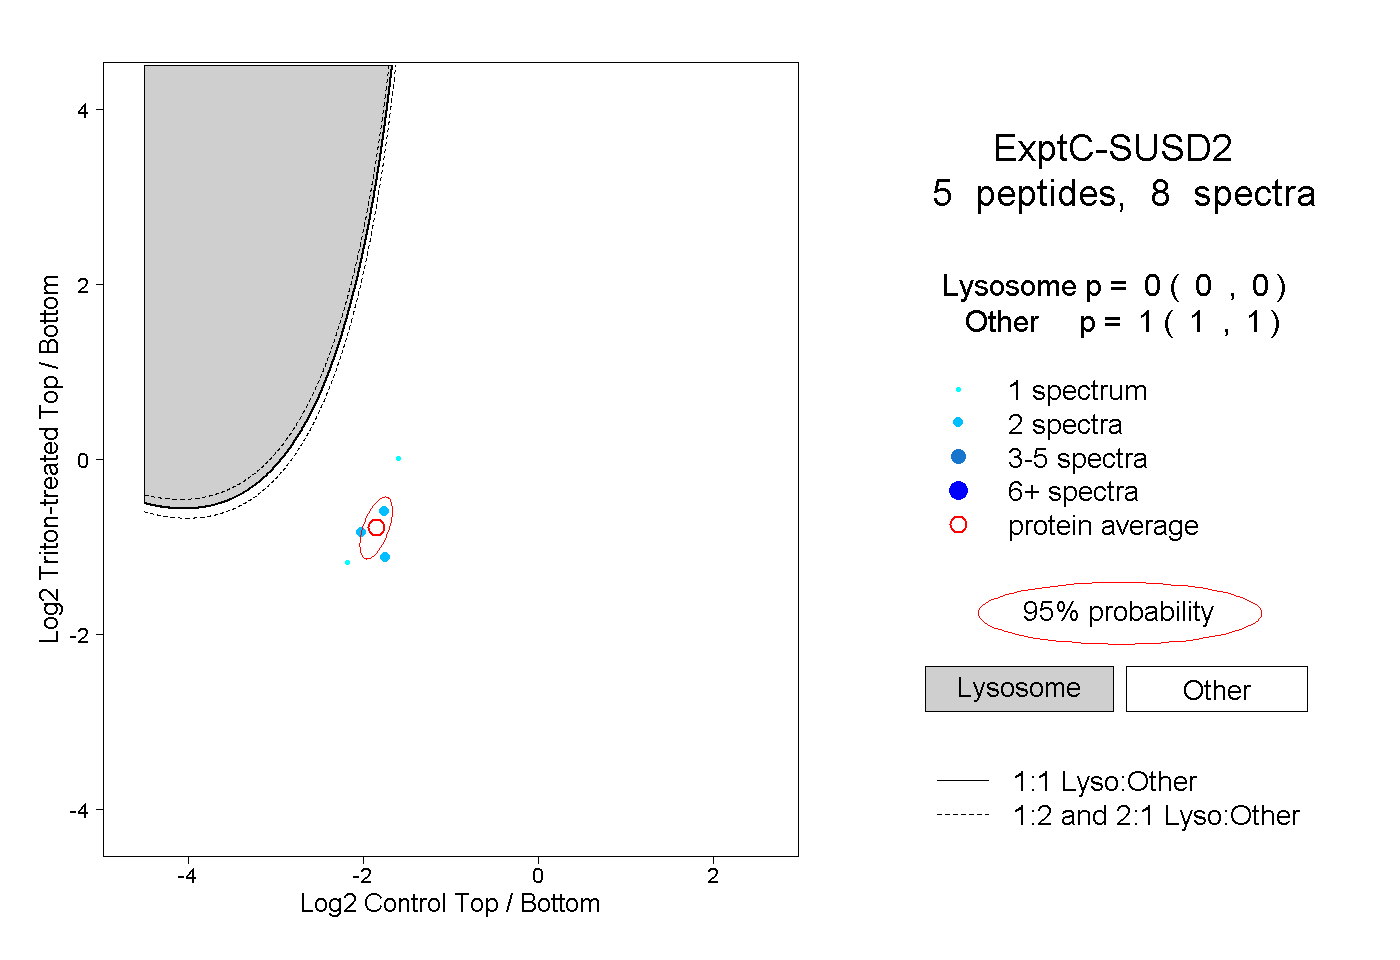 |
0.000 0.000 | 0.000 |
1.000 1.000 | 1.000 |
||||||||
| Plot | Lyso | Other | |||||||||||
| Expt D |
1 peptide |
1 spectrum |
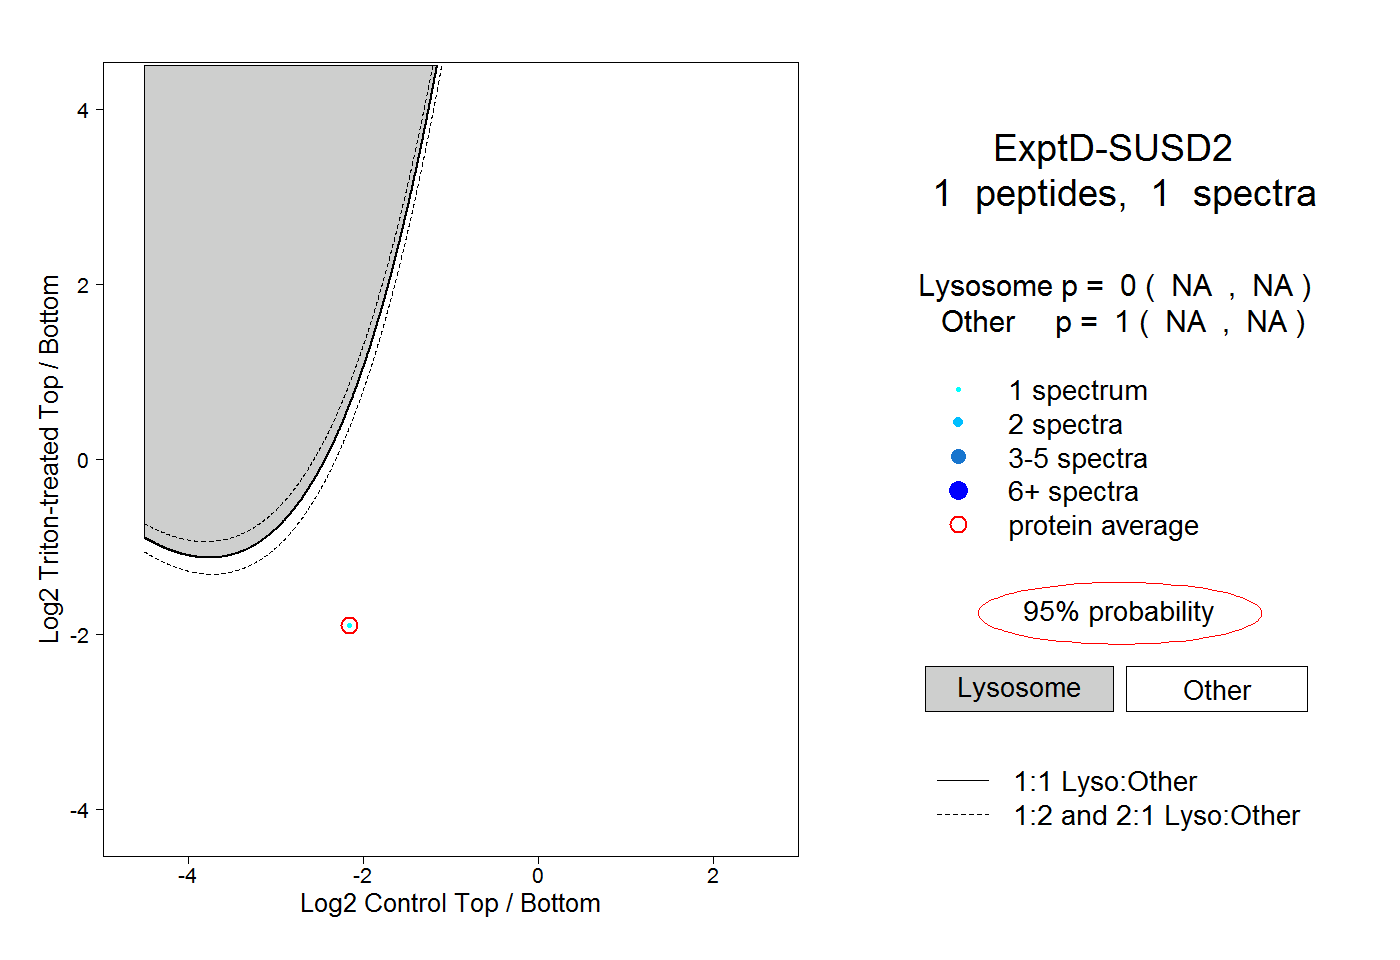 |
0.000 NA | NA |
1.000 NA | NA |