 24
24peptides
spectra
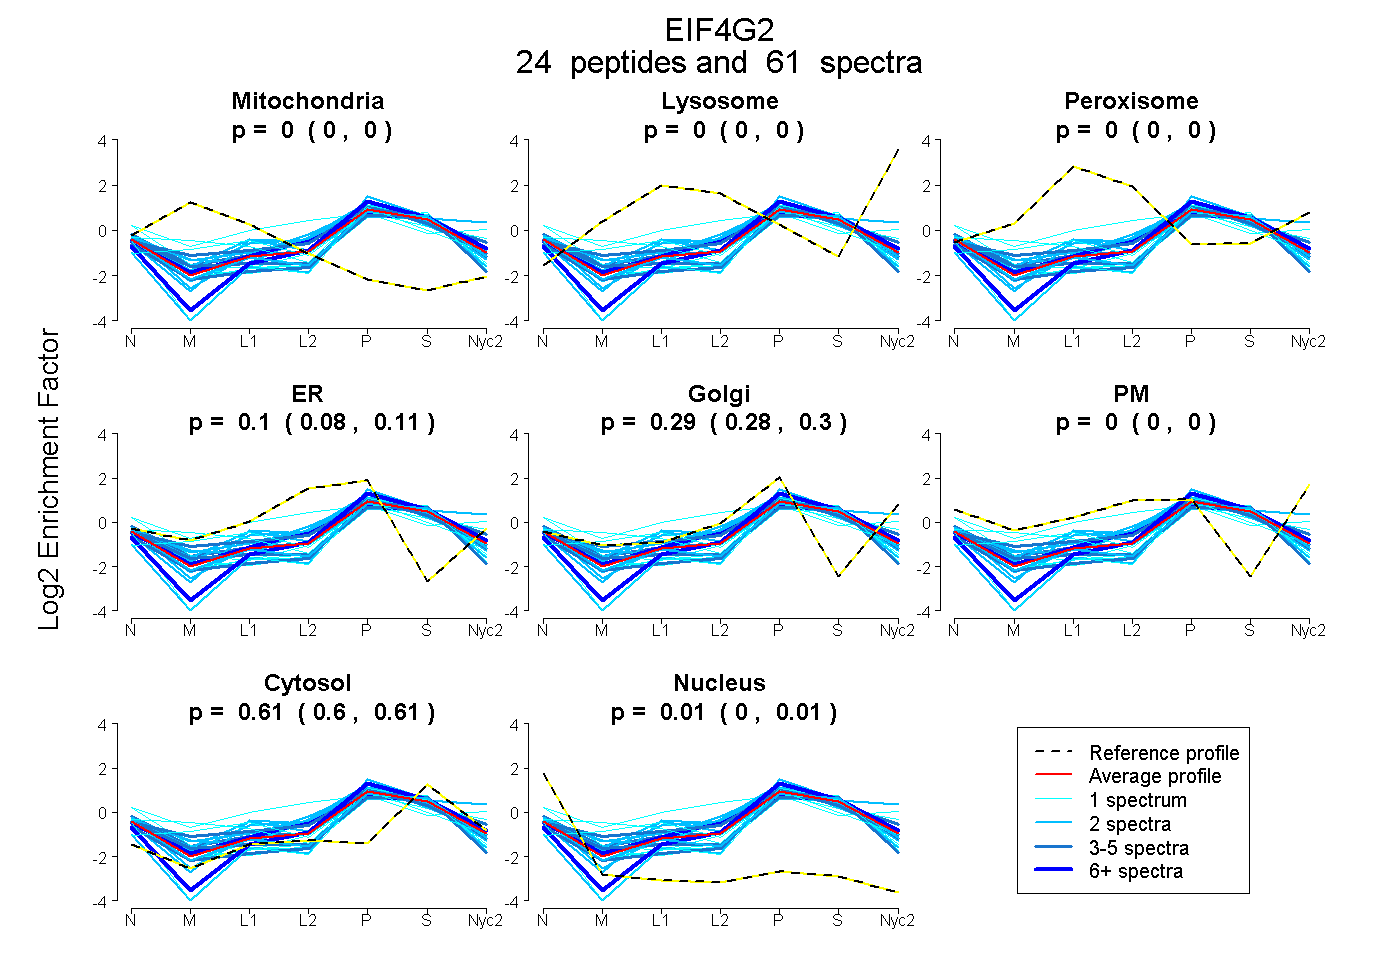
0.000 | 0.000
0.000 | 0.000
0.000 | 0.000
0.084 | 0.107
0.277 | 0.302
0.000 | 0.000
0.603 | 0.608
0.005 | 0.010
18peptides
spectra
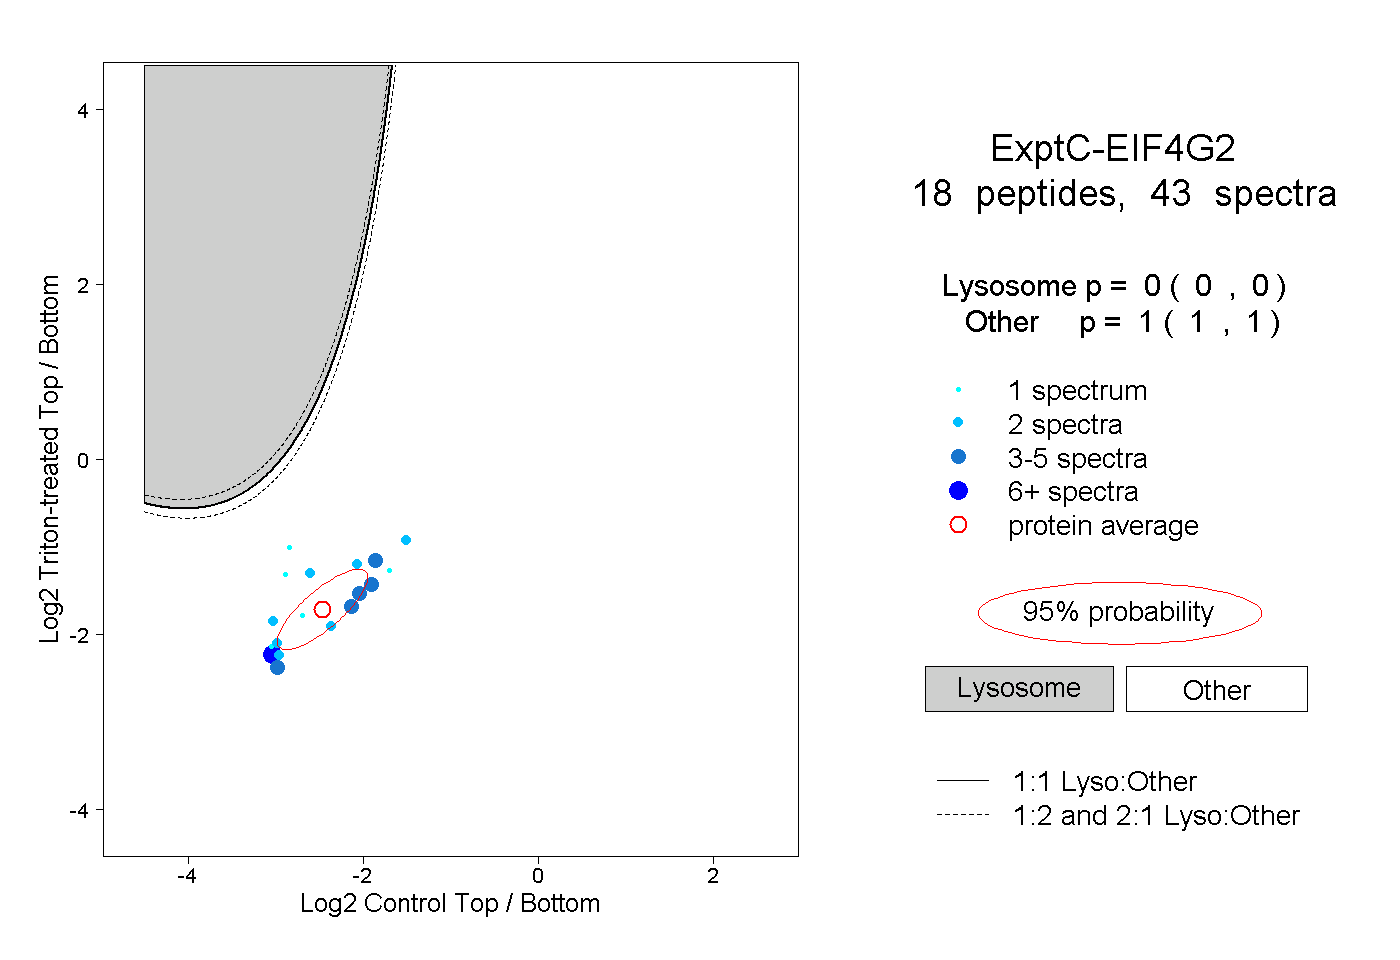
0.000 | 0.000
1.000 | 1.000
| Plot | Mito | Lyso | Perox | ER | Golgi | PM | Cytosol | Nucleus | |||||
| Expt A |
24 peptides |
61 spectra |
|
0.000 0.000 | 0.000 |
0.000 0.000 | 0.000 |
0.000 0.000 | 0.000 |
0.097 0.084 | 0.107 |
0.290 0.277 | 0.302 |
0.000 0.000 | 0.000 |
0.605 0.603 | 0.608 |
0.008 0.005 | 0.010 |
||
| Plot | Lyso | Other | |||||||||||
| Expt C |
18 peptides |
43 spectra |
|
0.000 0.000 | 0.000 |
1.000 1.000 | 1.000 |