 13
13peptides
spectra
0.000 | 0.000
0.000 | 0.000
0.000 | 0.000
0.000 | 0.000
0.873 | 0.893
0.000 | 0.000
0.017 | 0.051
0.070 | 0.089
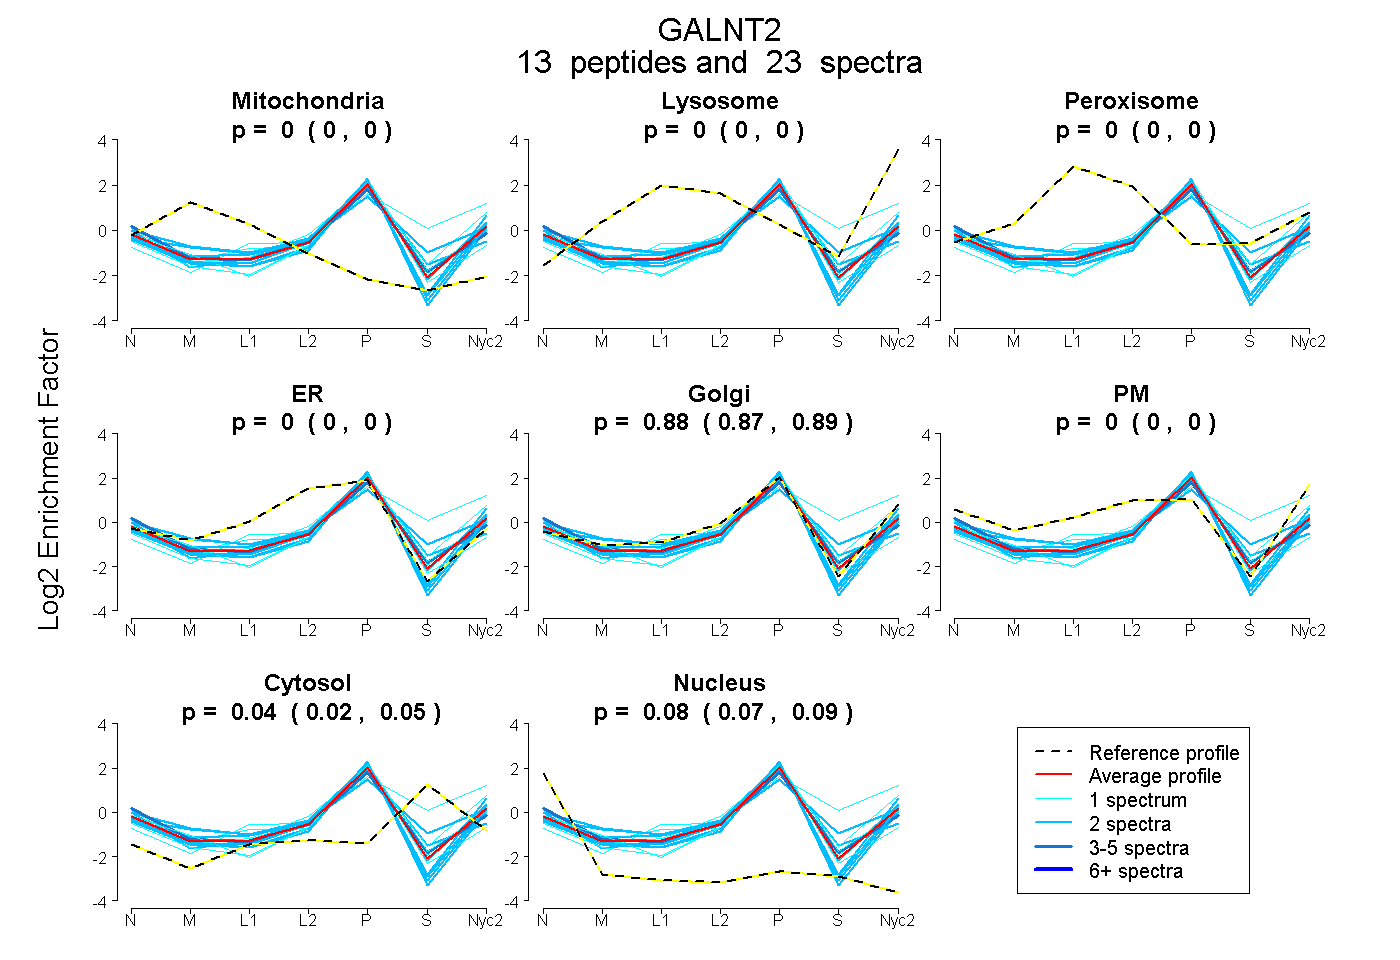
| Plot | Mito | Lyso | Perox | ER | Golgi | PM | Cytosol | Nucleus | |||||
| Expt A |
13 peptides |
23 spectra |
|
0.000 0.000 | 0.000 |
0.000 0.000 | 0.000 |
0.000 0.000 | 0.000 |
0.000 0.000 | 0.000 |
0.884 0.873 | 0.893 |
0.000 0.000 | 0.000 |
0.036 0.017 | 0.051 |
0.080 0.070 | 0.089 |
| 1 spectrum, WPDFNQEAYVGGTMVR | 0.000 | 0.000 | 0.000 | 0.000 | 0.827 | 0.000 | 0.102 | 0.071 | ||
| 2 spectra, SPPHLIK | 0.000 | 0.000 | 0.000 | 0.000 | 0.935 | 0.000 | 0.000 | 0.065 | ||
| 2 spectra, VDLPATSVVITFHNEAR | 0.037 | 0.000 | 0.008 | 0.000 | 0.680 | 0.052 | 0.222 | 0.000 | ||
| 4 spectra, VGHVFR | 0.000 | 0.000 | 0.000 | 0.020 | 0.801 | 0.000 | 0.063 | 0.116 | ||
| 2 spectra, TVVSVLK | 0.000 | 0.000 | 0.000 | 0.000 | 0.900 | 0.000 | 0.015 | 0.085 | ||
| 2 spectra, SGQDPYAR | 0.000 | 0.000 | 0.000 | 0.000 | 0.936 | 0.000 | 0.000 | 0.064 | ||
| 2 spectra, WYLDNVYPELR | 0.000 | 0.000 | 0.000 | 0.000 | 0.909 | 0.000 | 0.000 | 0.091 | ||
| 2 spectra, LGCKPFK | 0.023 | 0.000 | 0.000 | 0.181 | 0.614 | 0.000 | 0.141 | 0.041 | ||
| 2 spectra, QGNPVAPIK | 0.000 | 0.000 | 0.000 | 0.000 | 0.884 | 0.000 | 0.000 | 0.116 | ||
| 1 spectrum, SPGSLIR | 0.000 | 0.000 | 0.000 | 0.039 | 0.849 | 0.000 | 0.047 | 0.065 | ||
| 1 spectrum, GADAAQAK | 0.000 | 0.143 | 0.000 | 0.000 | 0.501 | 0.000 | 0.356 | 0.000 | ||
| 1 spectrum, VLTFLDSHCECNER | 0.000 | 0.000 | 0.000 | 0.000 | 0.827 | 0.000 | 0.000 | 0.173 | ||
| 1 spectrum, LYFEELGK | 0.000 | 0.000 | 0.000 | 0.000 | 0.867 | 0.000 | 0.133 | 0.000 |
| Plot | Mito | Lyso or Perox | ER | Golgi | PM | Cytosol | Nucleus | ||||||
| Expt B |
1 peptide |
1 spectrum |
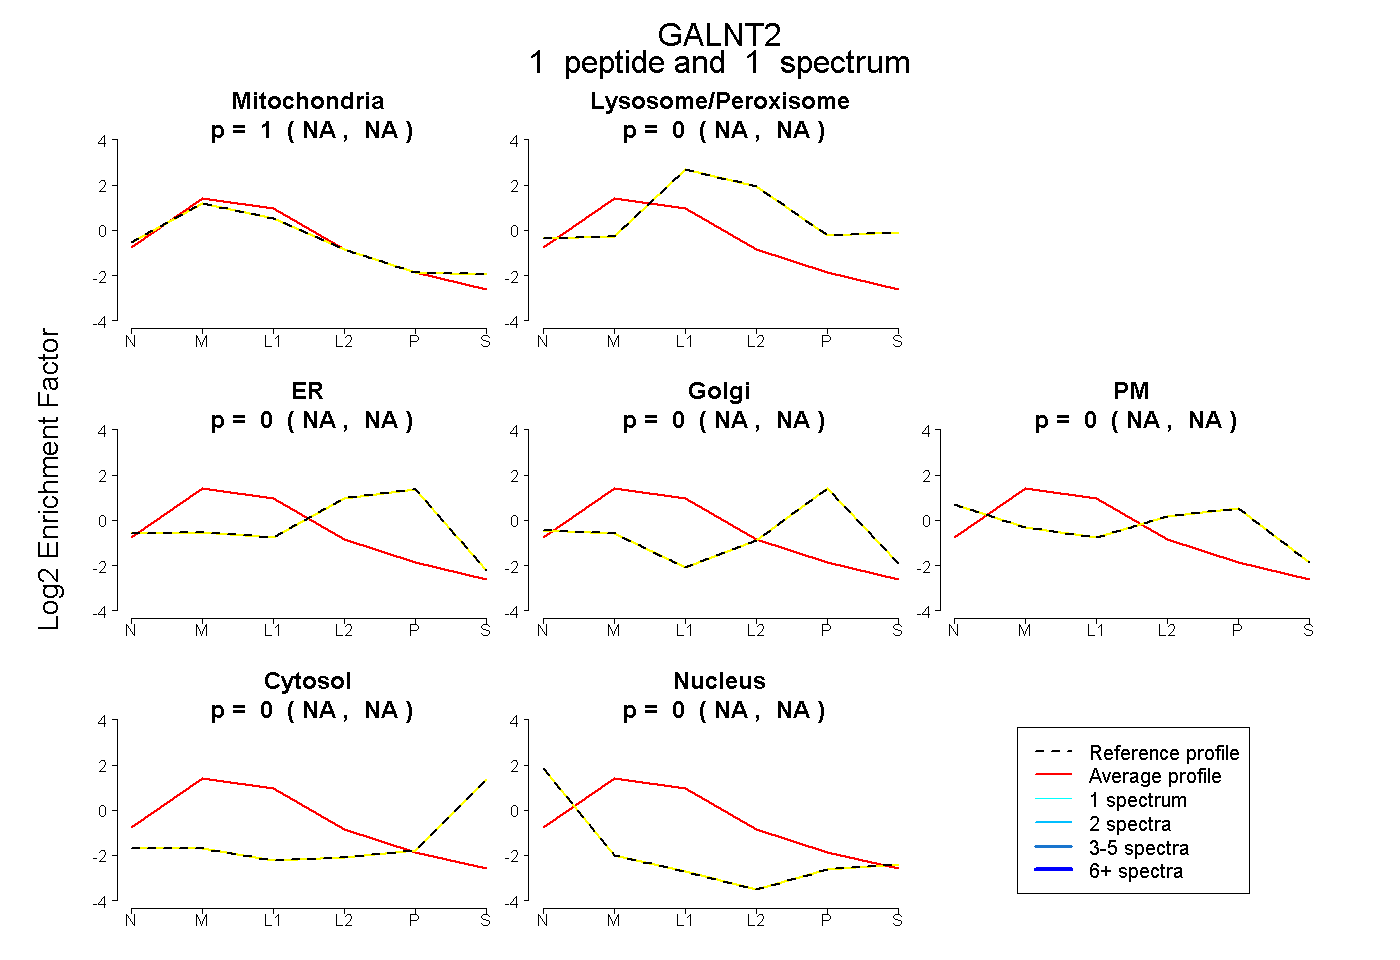 |
1.000 NA | NA |
0.000 NA | NA |
0.000 NA | NA |
0.000 NA | NA |
0.000 NA | NA |
0.000 NA | NA |
0.000 NA | NA |
|||
| Plot | Lyso | Other | |||||||||||
| Expt C |
7 peptides |
21 spectra |
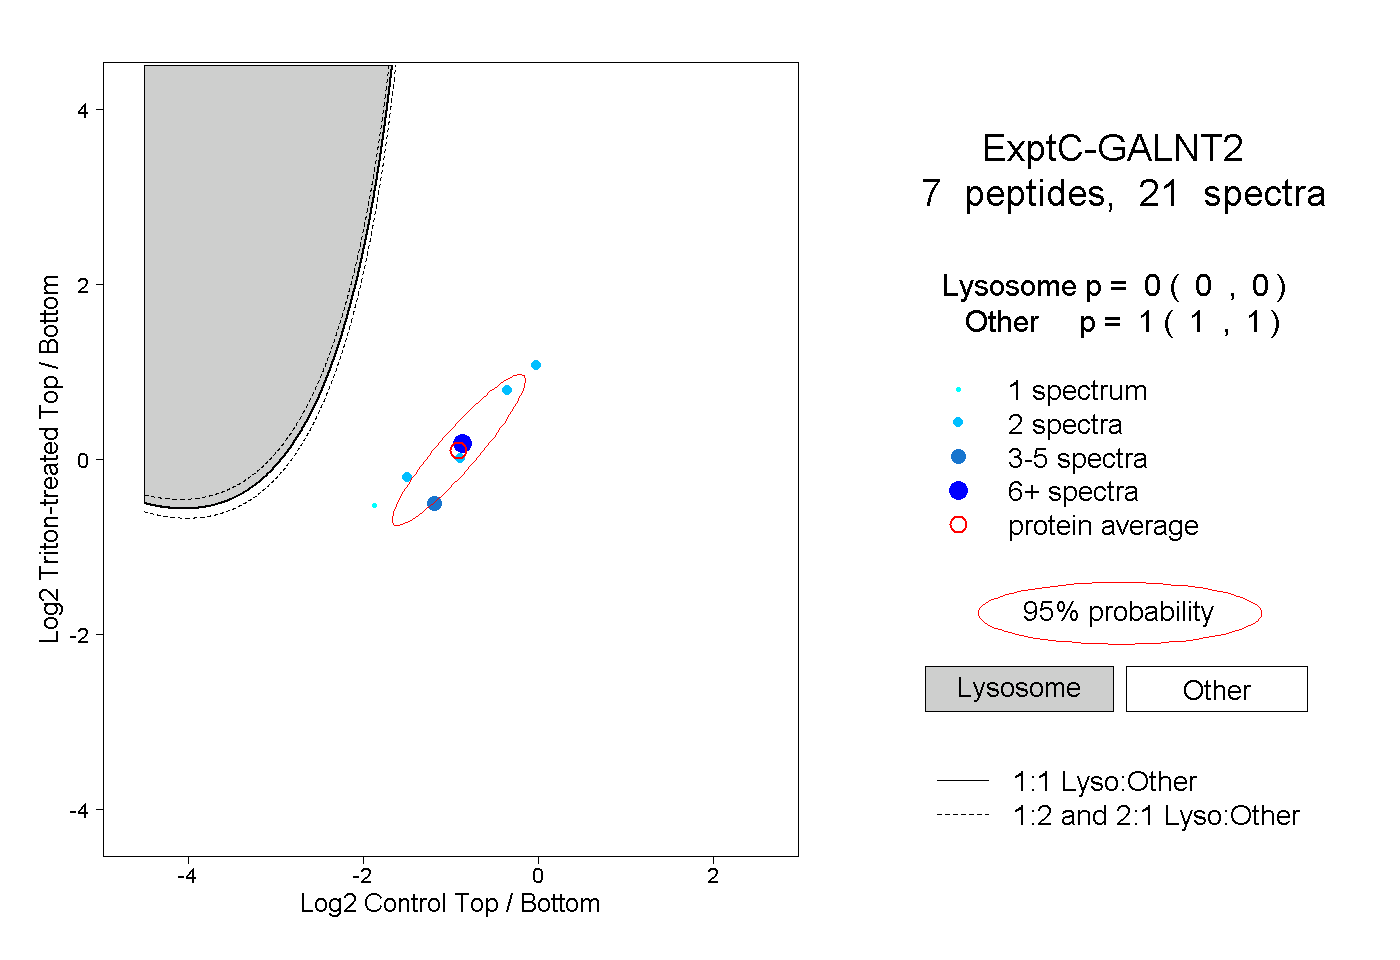 |
0.000 0.000 | 0.000 |
1.000 1.000 | 1.000 |
||||||||
| Plot | Lyso | Other | |||||||||||
| Expt D |
2 peptides |
3 spectra |
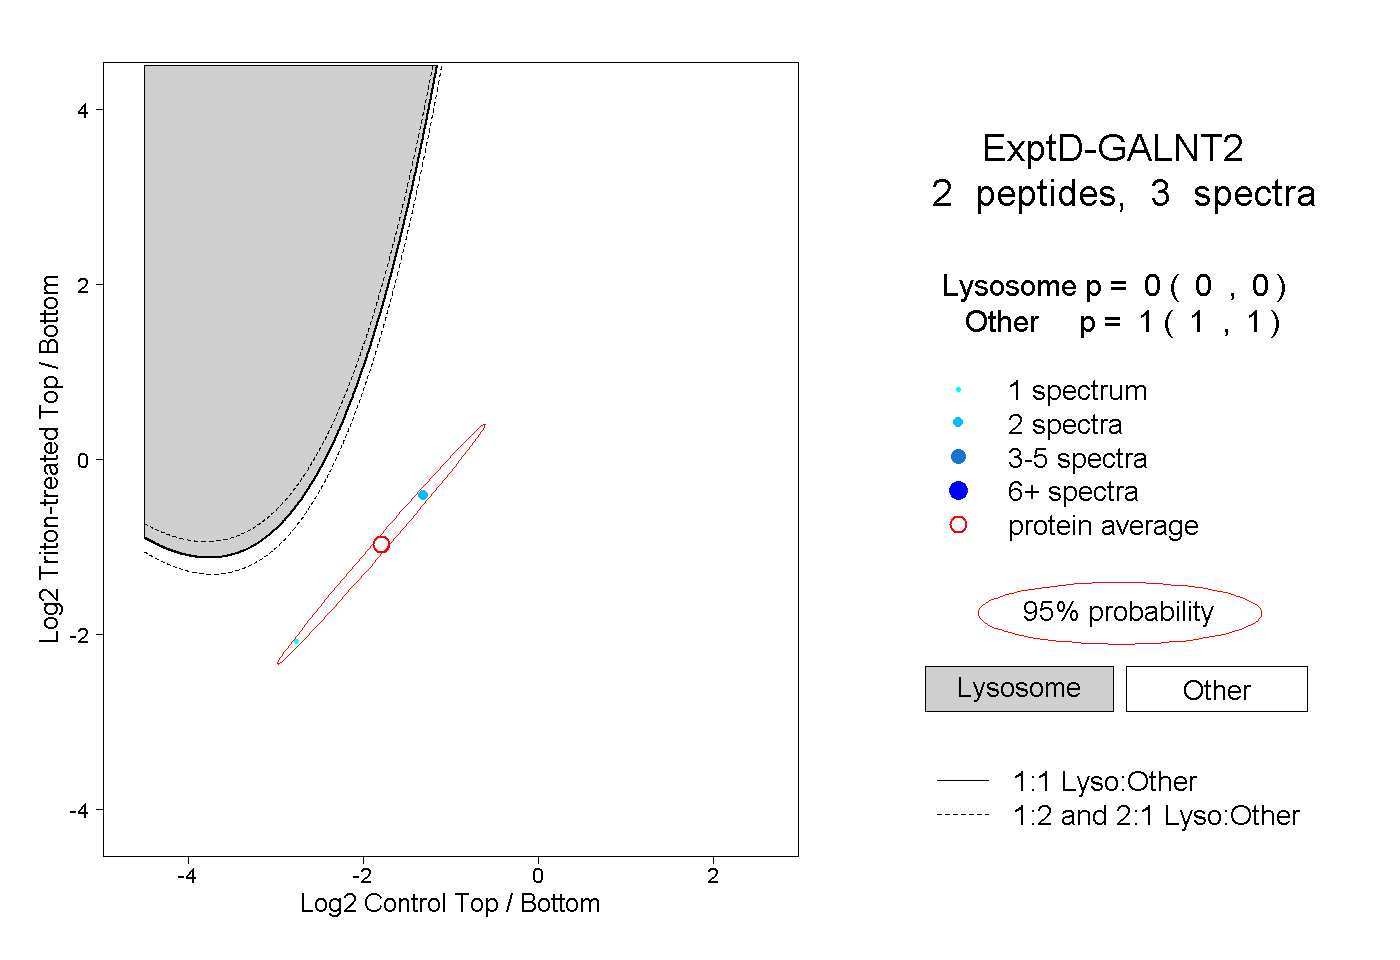 |
0.000 0.000 | 0.000 |
1.000 1.000 | 1.000 |