10
10peptides
spectra
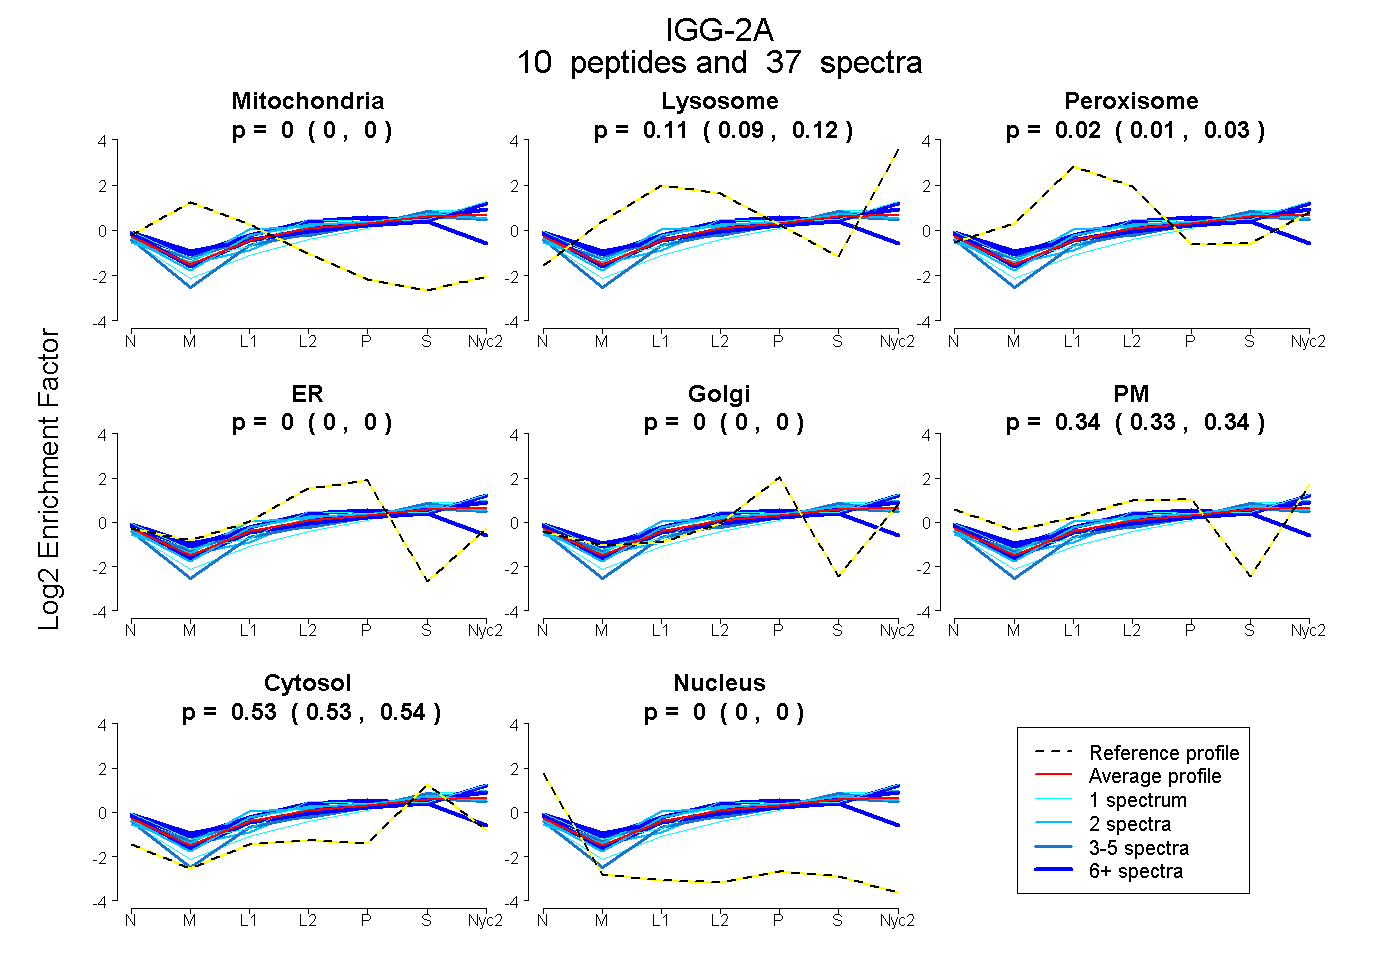
0.000 | 0.000
0.094 | 0.124
0.007 | 0.033
0.000 | 0.000
0.000 | 0.000
0.330 | 0.341
0.528 | 0.536
0.000 | 0.000
8peptides
spectra
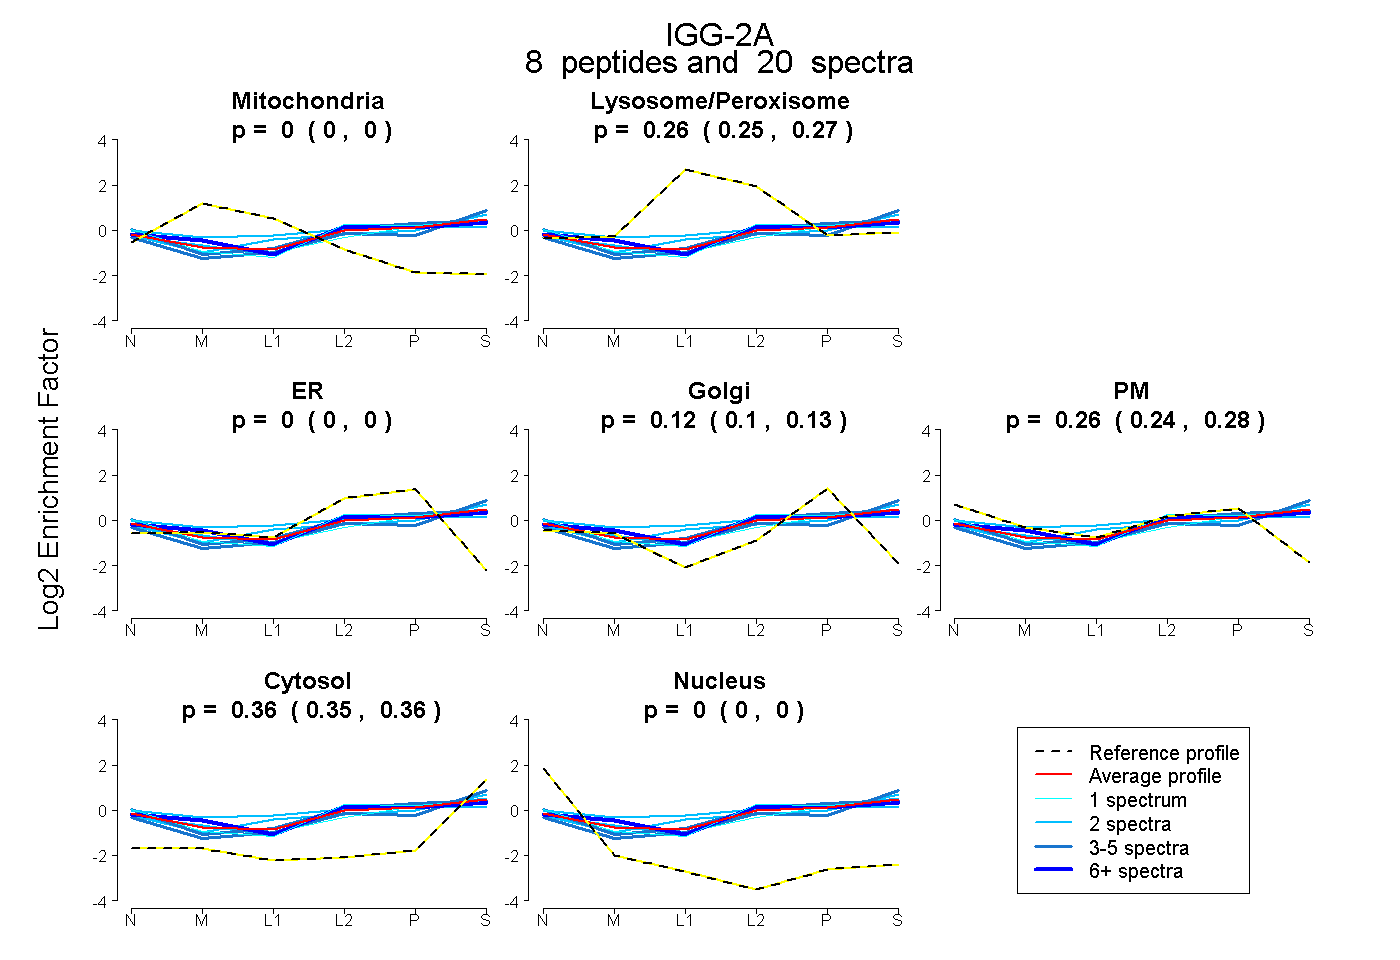
0.000 | 0.000
0.248 | 0.269
0.000 | 0.000
0.104 | 0.134
0.244 | 0.280
0.351 | 0.364
0.000 | 0.000