 10
10peptides
spectra
0.000 | 0.000
0.094 | 0.124
0.007 | 0.033
0.000 | 0.000
0.000 | 0.000
0.330 | 0.341
0.528 | 0.536
0.000 | 0.000
| Plot | Mito | Lyso | Perox | ER | Golgi | PM | Cytosol | Nucleus | |||||
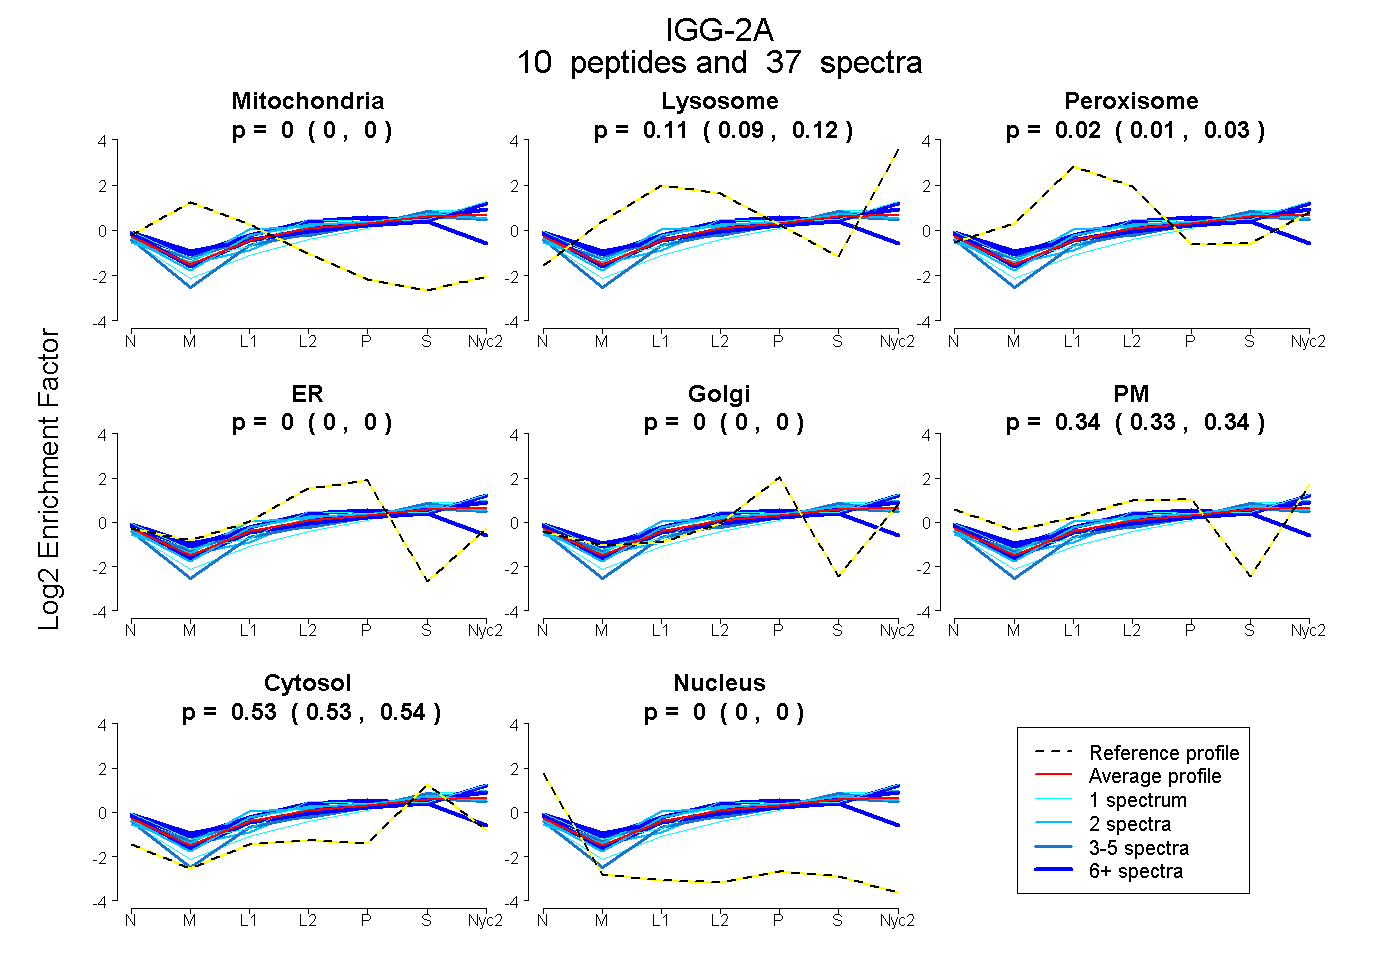
| Expt A |
10 peptides |
37 spectra |
|
0.000 0.000 | 0.000 |
0.110 0.094 | 0.124 |
0.021 0.007 | 0.033 |
0.000 0.000 | 0.000 |
0.000 0.000 | 0.000 |
0.336 0.330 | 0.341 |
0.533 0.528 | 0.536 |
0.000 0.000 | 0.000 |
| 4 spectra, GFYPPDIYTEWK | 0.000 | 0.096 | 0.086 | 0.000 | 0.087 | 0.198 | 0.533 | 0.000 | ||
| 3 spectra, FSWFIDDVEVHTAQTHAPEK | 0.000 | 0.057 | 0.000 | 0.000 | 0.038 | 0.256 | 0.649 | 0.000 | ||
| 6 spectra, SNSMVTLGCLVK | 0.013 | 0.000 | 0.134 | 0.236 | 0.000 | 0.100 | 0.518 | 0.000 | ||
| 2 spectra, SVSELPIVHR | 0.000 | 0.098 | 0.082 | 0.059 | 0.000 | 0.228 | 0.533 | 0.000 | ||
| 1 spectrum, VNSGAFPAPIEK | 0.000 | 0.148 | 0.000 | 0.000 | 0.000 | 0.399 | 0.452 | 0.000 | ||
| 10 spectra, SISKPEGTPR | 0.000 | 0.118 | 0.000 | 0.000 | 0.000 | 0.363 | 0.519 | 0.000 | ||
| 2 spectra, NTPPTMDTDGSYFLYSK | 0.000 | 0.216 | 0.077 | 0.000 | 0.000 | 0.198 | 0.509 | 0.000 | ||
| 2 spectra, DWLNGK | 0.000 | 0.103 | 0.000 | 0.000 | 0.001 | 0.374 | 0.522 | 0.000 | ||
| 6 spectra, MNGQPQENYK | 0.000 | 0.215 | 0.000 | 0.000 | 0.000 | 0.359 | 0.427 | 0.000 | ||
| 1 spectrum, DVLTITLTPK | 0.000 | 0.091 | 0.000 | 0.000 | 0.073 | 0.196 | 0.639 | 0.000 |
| Plot | Mito | Lyso or Perox | ER | Golgi | PM | Cytosol | Nucleus | ||||||
| Expt B |
8 peptides |
20 spectra |
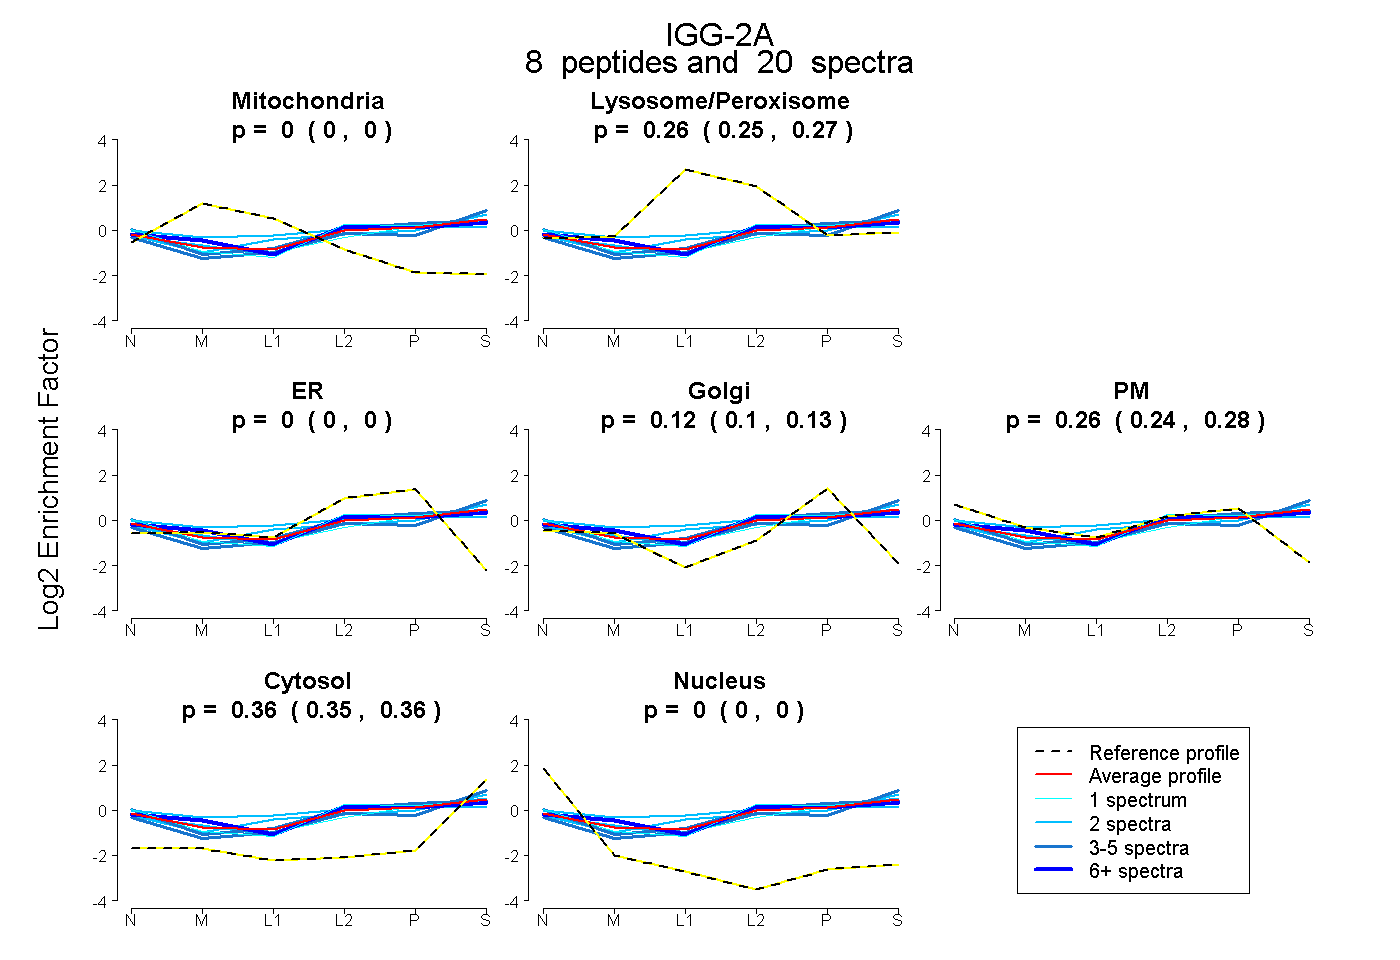 |
0.000 0.000 | 0.000 |
0.259 0.248 | 0.269 |
0.000 0.000 | 0.000 |
0.120 0.104 | 0.134 |
0.263 0.244 | 0.280 |
0.358 0.351 | 0.364 |
0.000 0.000 | 0.000 |
|||
| Plot | Lyso | Other | |||||||||||
| Expt C |
10 peptides |
30 spectra |
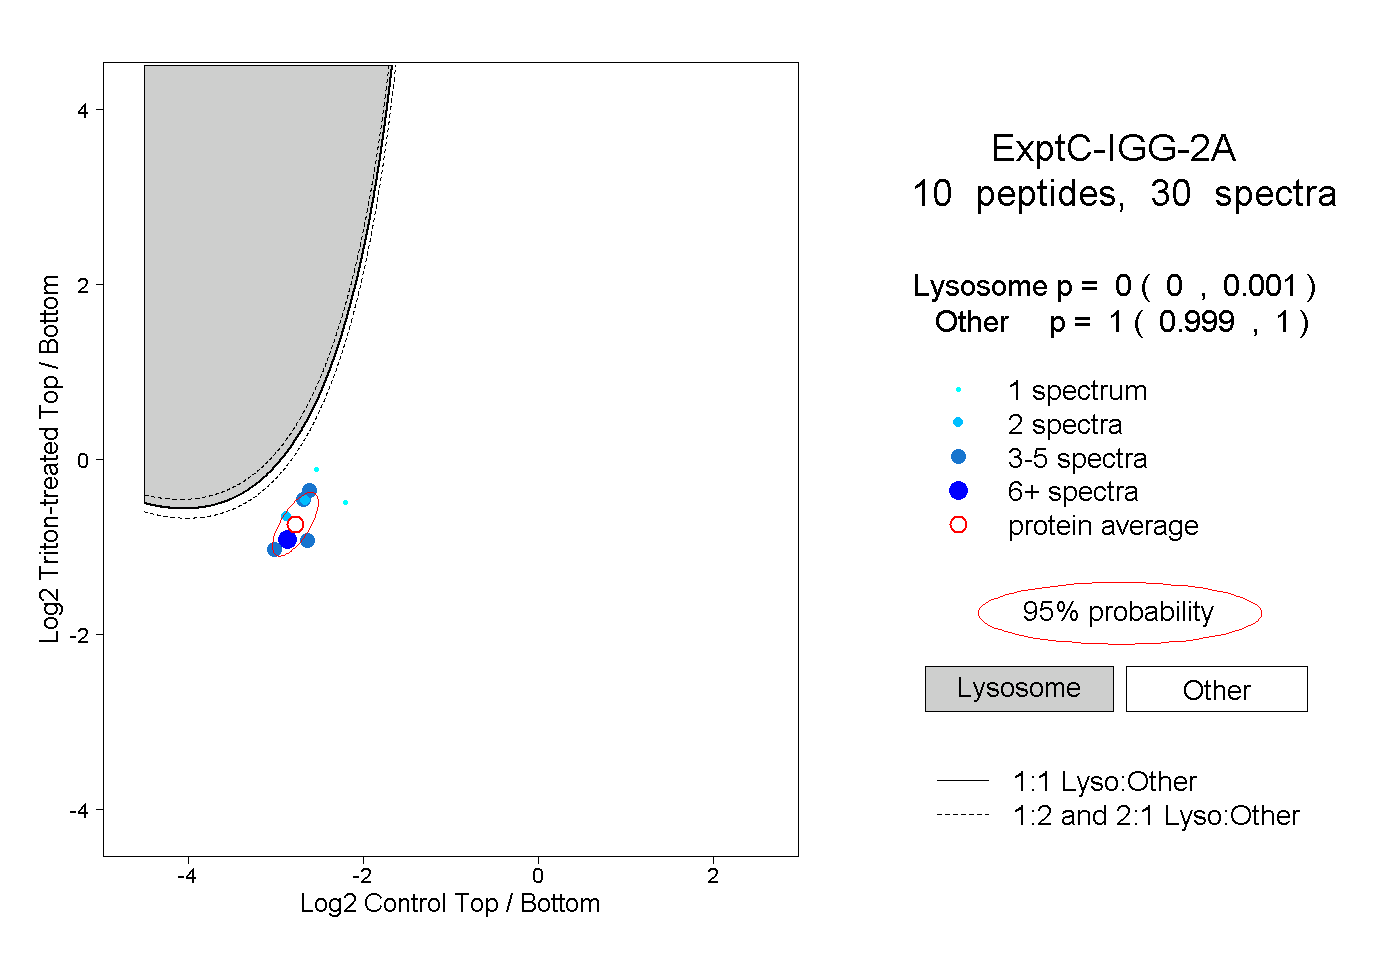 |
0.000 0.000 | 0.001 |
1.000 0.999 | 1.000 |
||||||||
| Plot | Lyso | Other | |||||||||||
| Expt D |
4 peptides |
6 spectra |
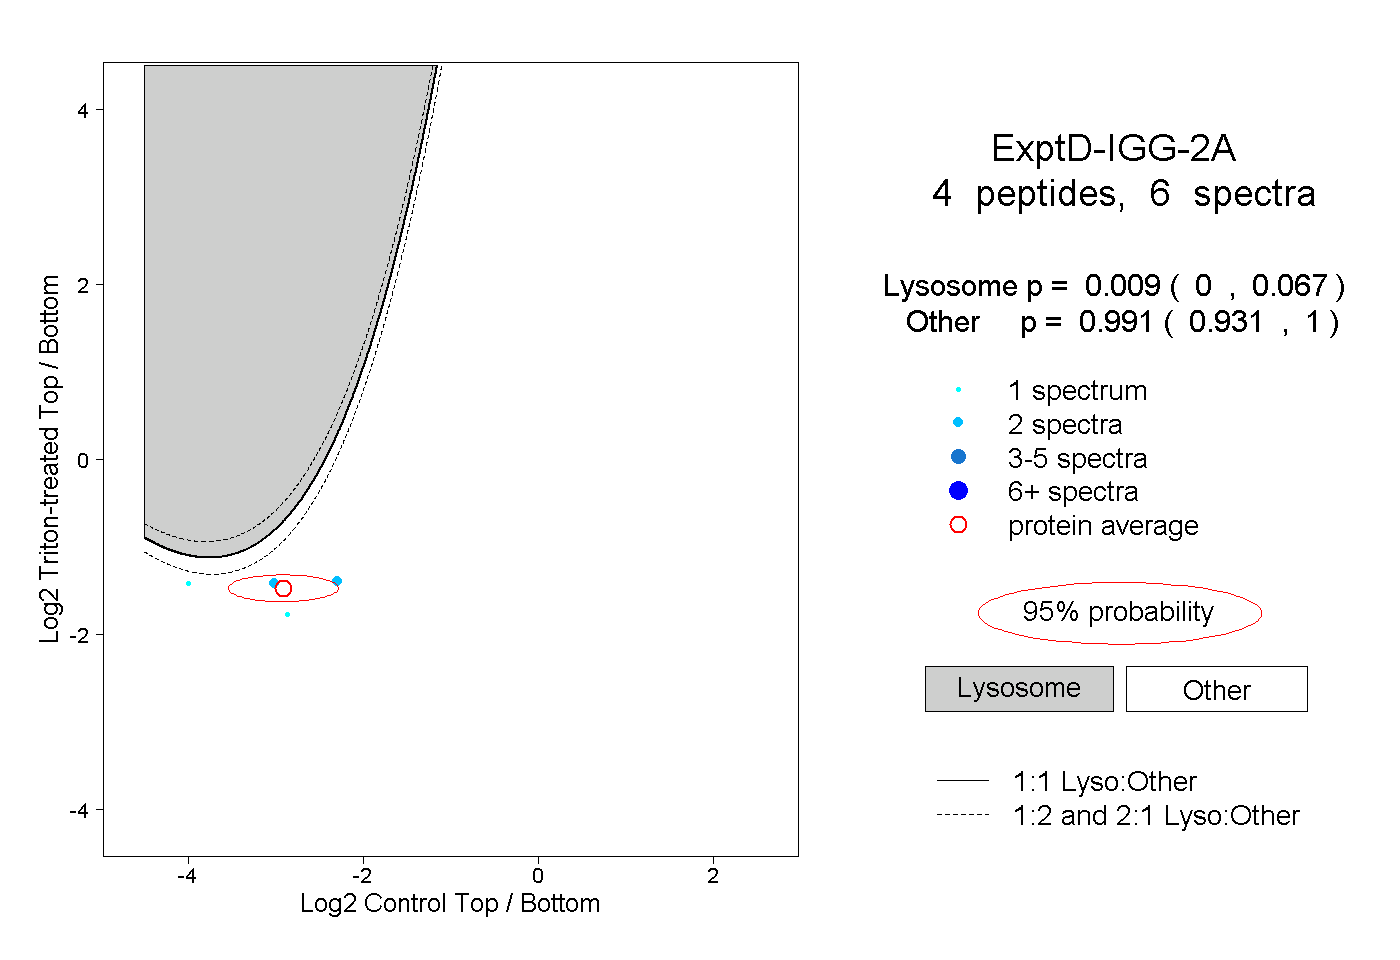 |
0.009 0.000 | 0.067 |
0.991 0.931 | 1.000 |