 9
9peptides
spectra
0.000 | 0.000
0.000 | 0.000
0.000 | 0.000
0.000 | 0.000
0.000 | 0.000
0.401 | 0.417
0.343 | 0.361
0.230 | 0.244
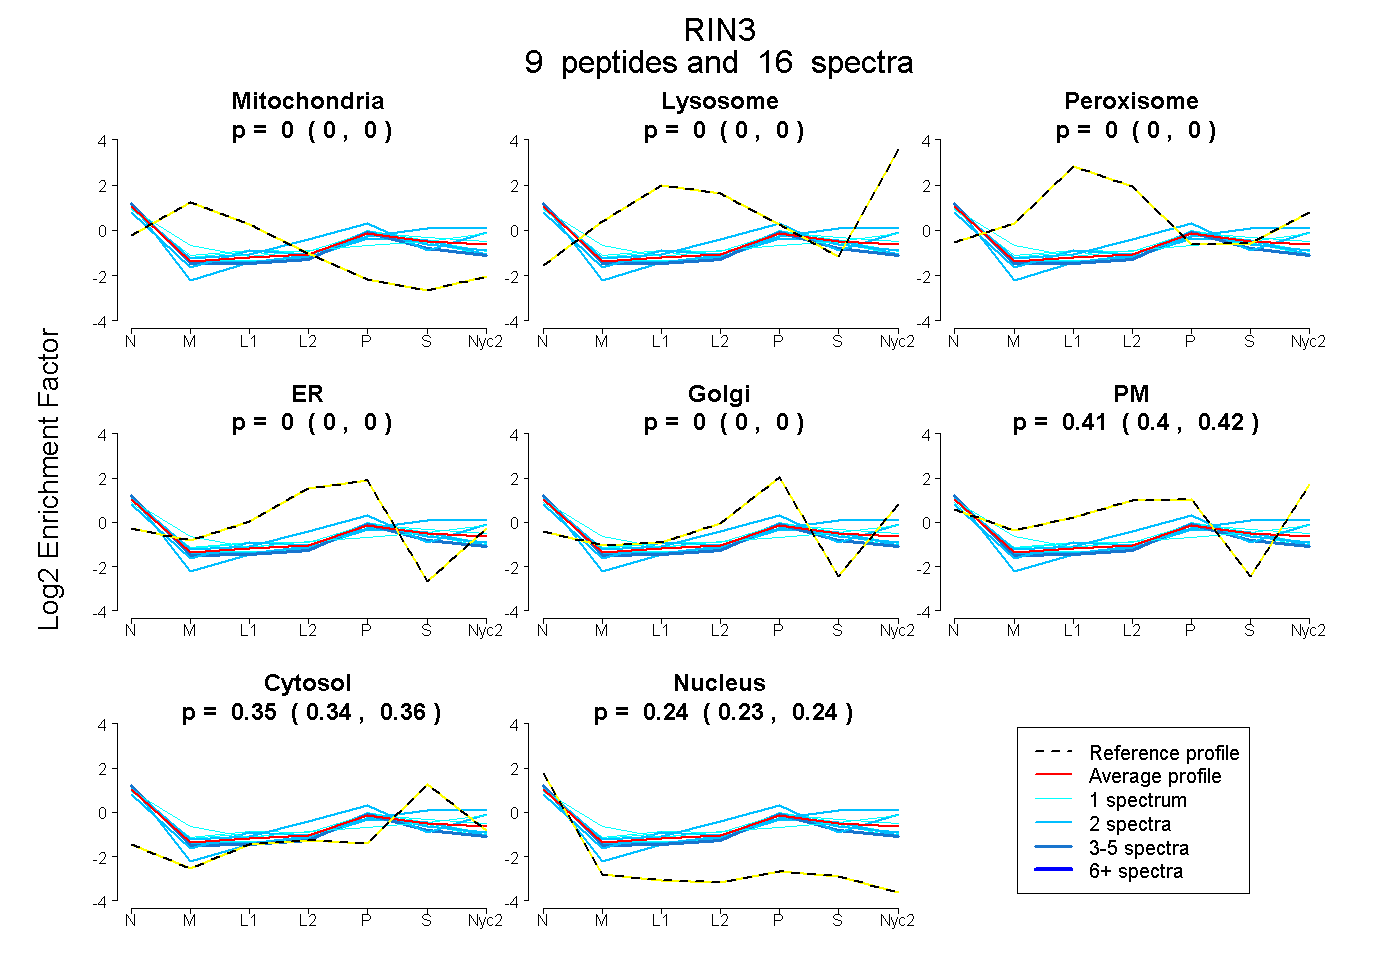
| Plot | Mito | Lyso | Perox | ER | Golgi | PM | Cytosol | Nucleus | |||||
| Expt A |
9 peptides |
16 spectra |
|
0.000 0.000 | 0.000 |
0.000 0.000 | 0.000 |
0.000 0.000 | 0.000 |
0.000 0.000 | 0.000 |
0.000 0.000 | 0.000 |
0.410 0.401 | 0.417 |
0.353 0.343 | 0.361 |
0.238 0.230 | 0.244 |
| 2 spectra, QTSSTEMLQEIR | 0.000 | 0.000 | 0.000 | 0.000 | 0.000 | 0.394 | 0.497 | 0.108 | ||
| 1 spectrum, DASNQPYLVVR | 0.000 | 0.000 | 0.070 | 0.000 | 0.119 | 0.241 | 0.311 | 0.259 | ||
| 2 spectra, GPAEPLR | 0.000 | 0.000 | 0.000 | 0.000 | 0.081 | 0.332 | 0.312 | 0.276 | ||
| 1 spectrum, VVELAQDK | 0.089 | 0.000 | 0.000 | 0.000 | 0.000 | 0.408 | 0.344 | 0.160 | ||
| 2 spectra, LTNMHK | 0.000 | 0.000 | 0.000 | 0.000 | 0.038 | 0.522 | 0.259 | 0.181 | ||
| 1 spectrum, GSYFGSLVQDYK | 0.000 | 0.000 | 0.032 | 0.000 | 0.000 | 0.409 | 0.370 | 0.189 | ||
| 1 spectrum, FEVAQPQDYR | 0.000 | 0.000 | 0.000 | 0.000 | 0.012 | 0.352 | 0.338 | 0.298 | ||
| 4 spectra, LFVLVDGR | 0.000 | 0.000 | 0.000 | 0.000 | 0.100 | 0.301 | 0.275 | 0.324 | ||
| 2 spectra, DLLPFTLR | 0.000 | 0.000 | 0.000 | 0.000 | 0.004 | 0.308 | 0.383 | 0.306 |
| Plot | Mito | Lyso or Perox | ER | Golgi | PM | Cytosol | Nucleus | ||||||
| Expt B |
1 peptide |
2 spectra |
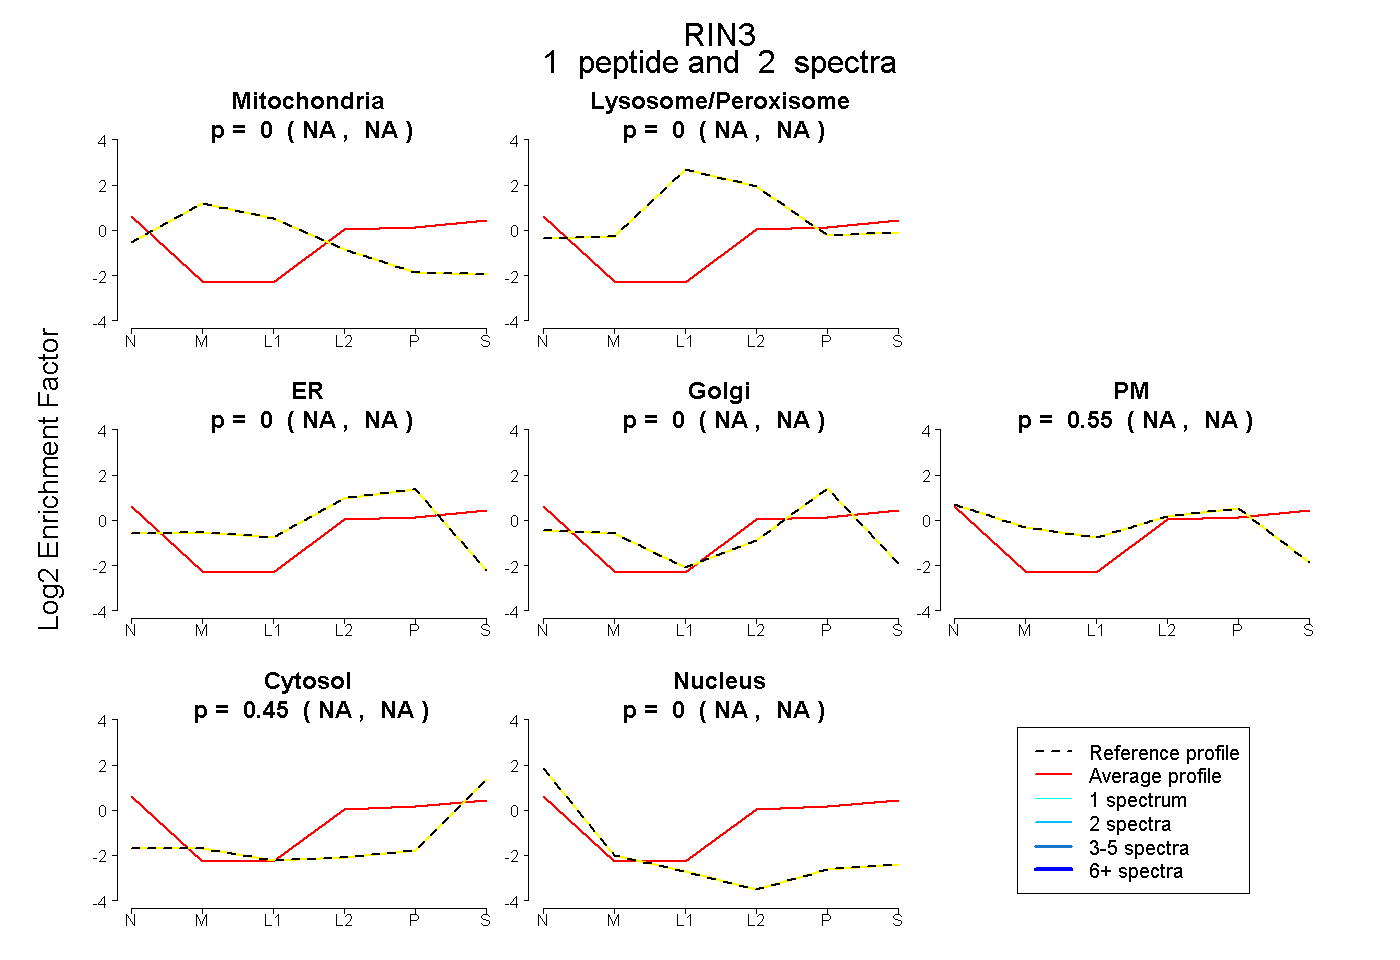 |
0.000 NA | NA |
0.000 NA | NA |
0.000 NA | NA |
0.000 NA | NA |
0.552 NA | NA |
0.448 NA | NA |
0.000 NA | NA |
|||
| Plot | Lyso | Other | |||||||||||
| Expt C |
4 peptides |
11 spectra |
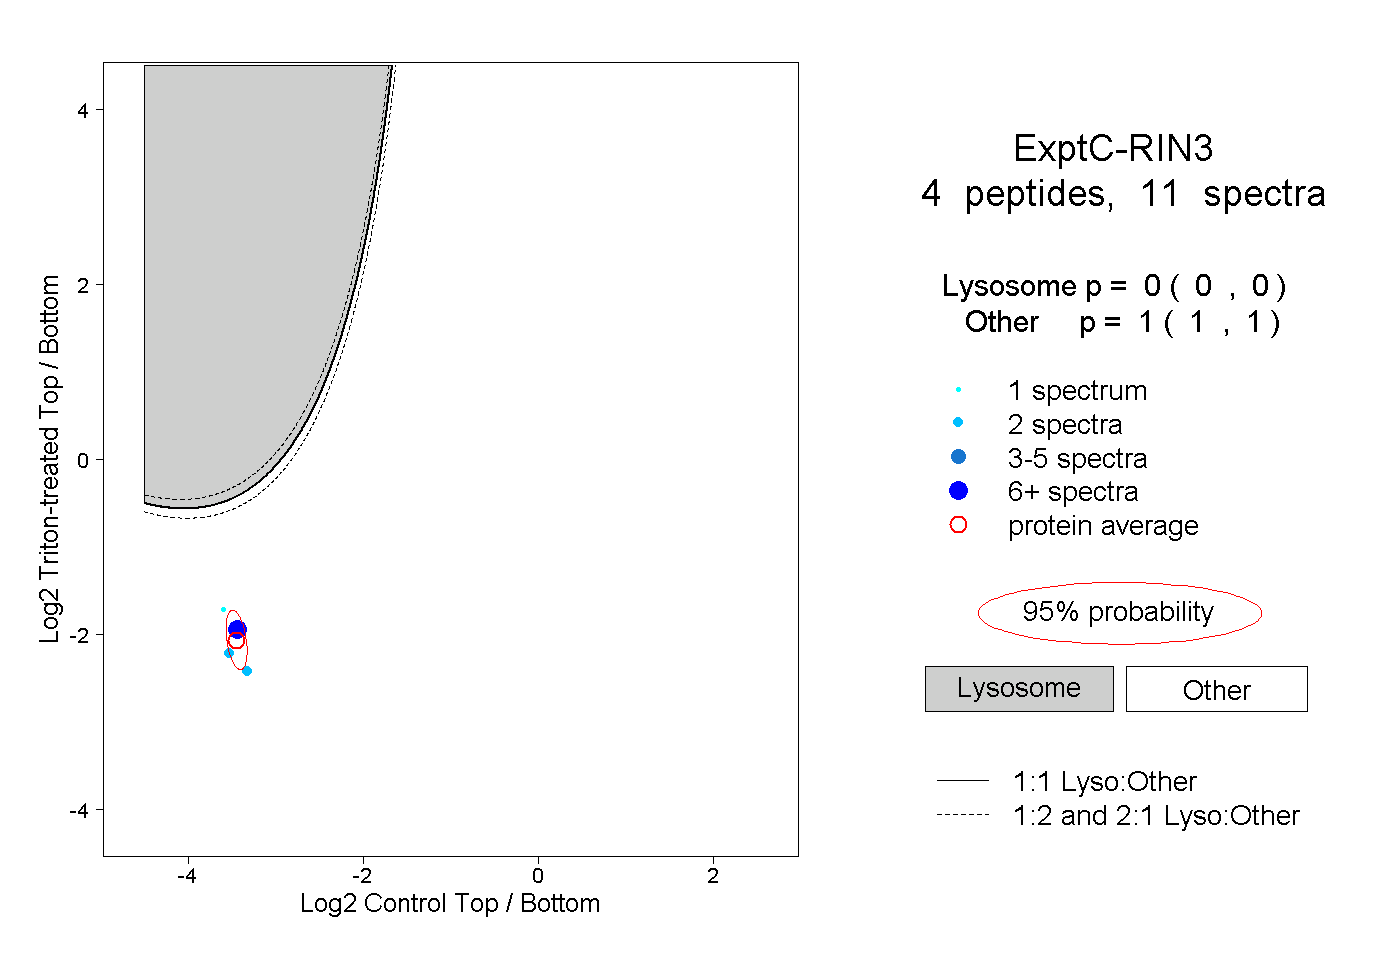 |
0.000 0.000 | 0.000 |
1.000 1.000 | 1.000 |